3 Steps to Project Control
No complex spreadsheets, no manual reports. Build, Report, Analyze — the system auto-calculates schedule and cost, so you always know: "Where are we? How long to go? Are we over budget?" Simple, clear, actionable.
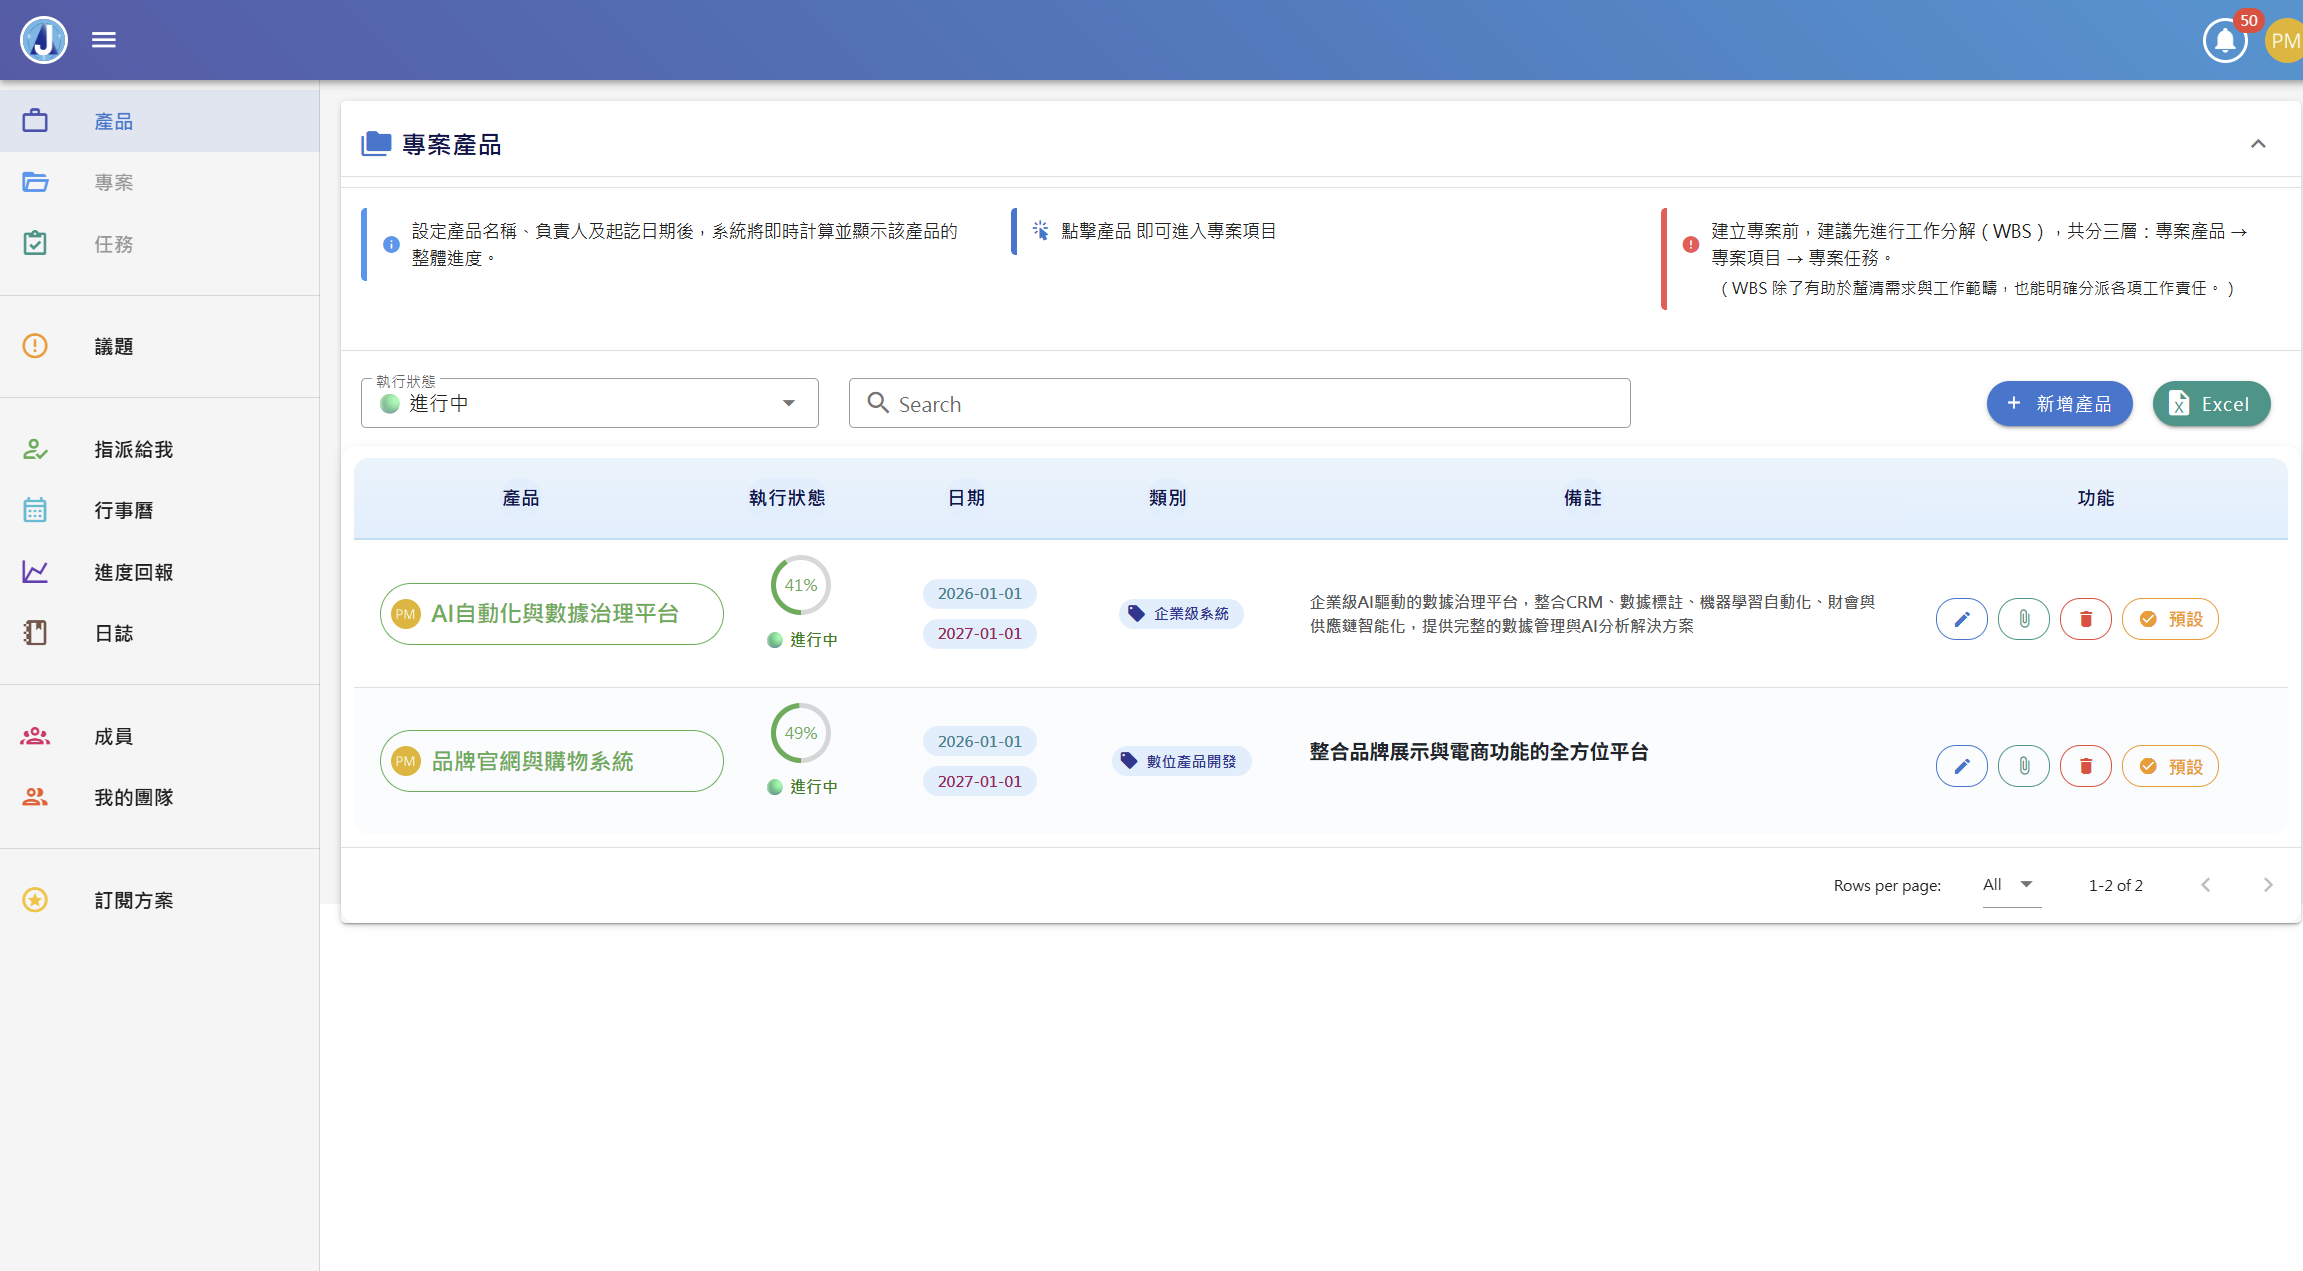
Step 1: Build Your Project Structure
How do you manage a large project? Break it down first!
Split the project into three layers — "Product → Work Package → Task." Every piece of work has a clear owner and scope, so nothing falls through the cracks.
- Layer 1: Products
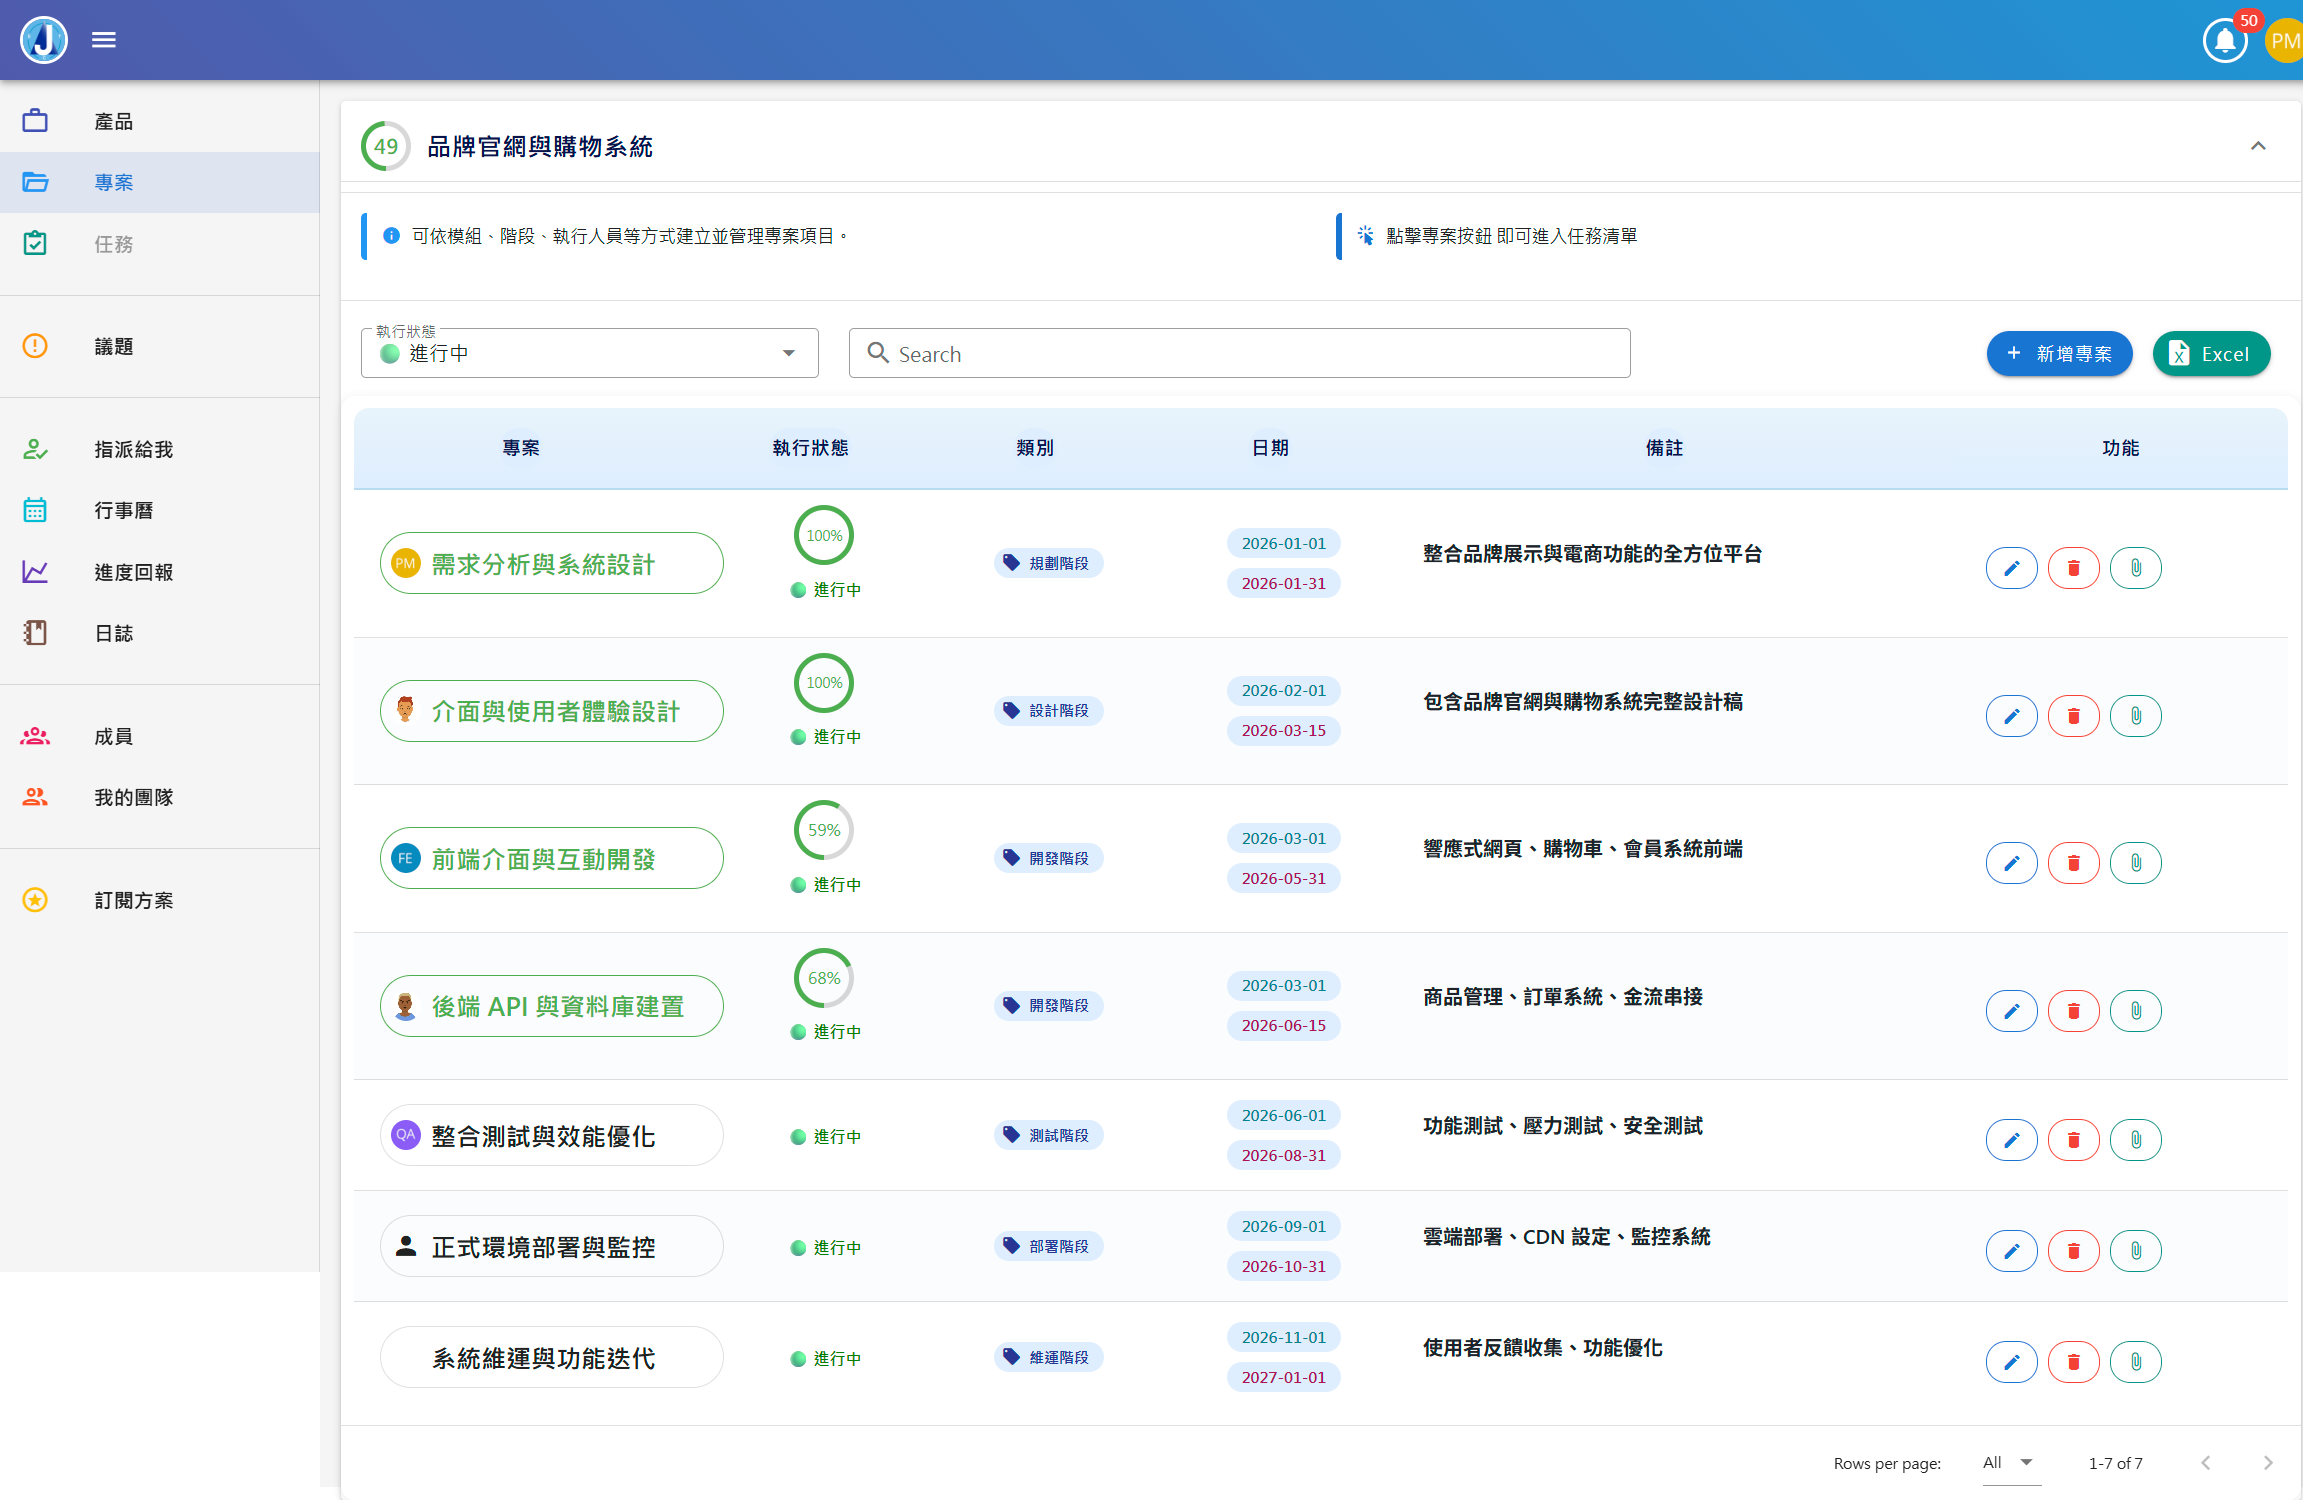
- Layer 2: Work Packages
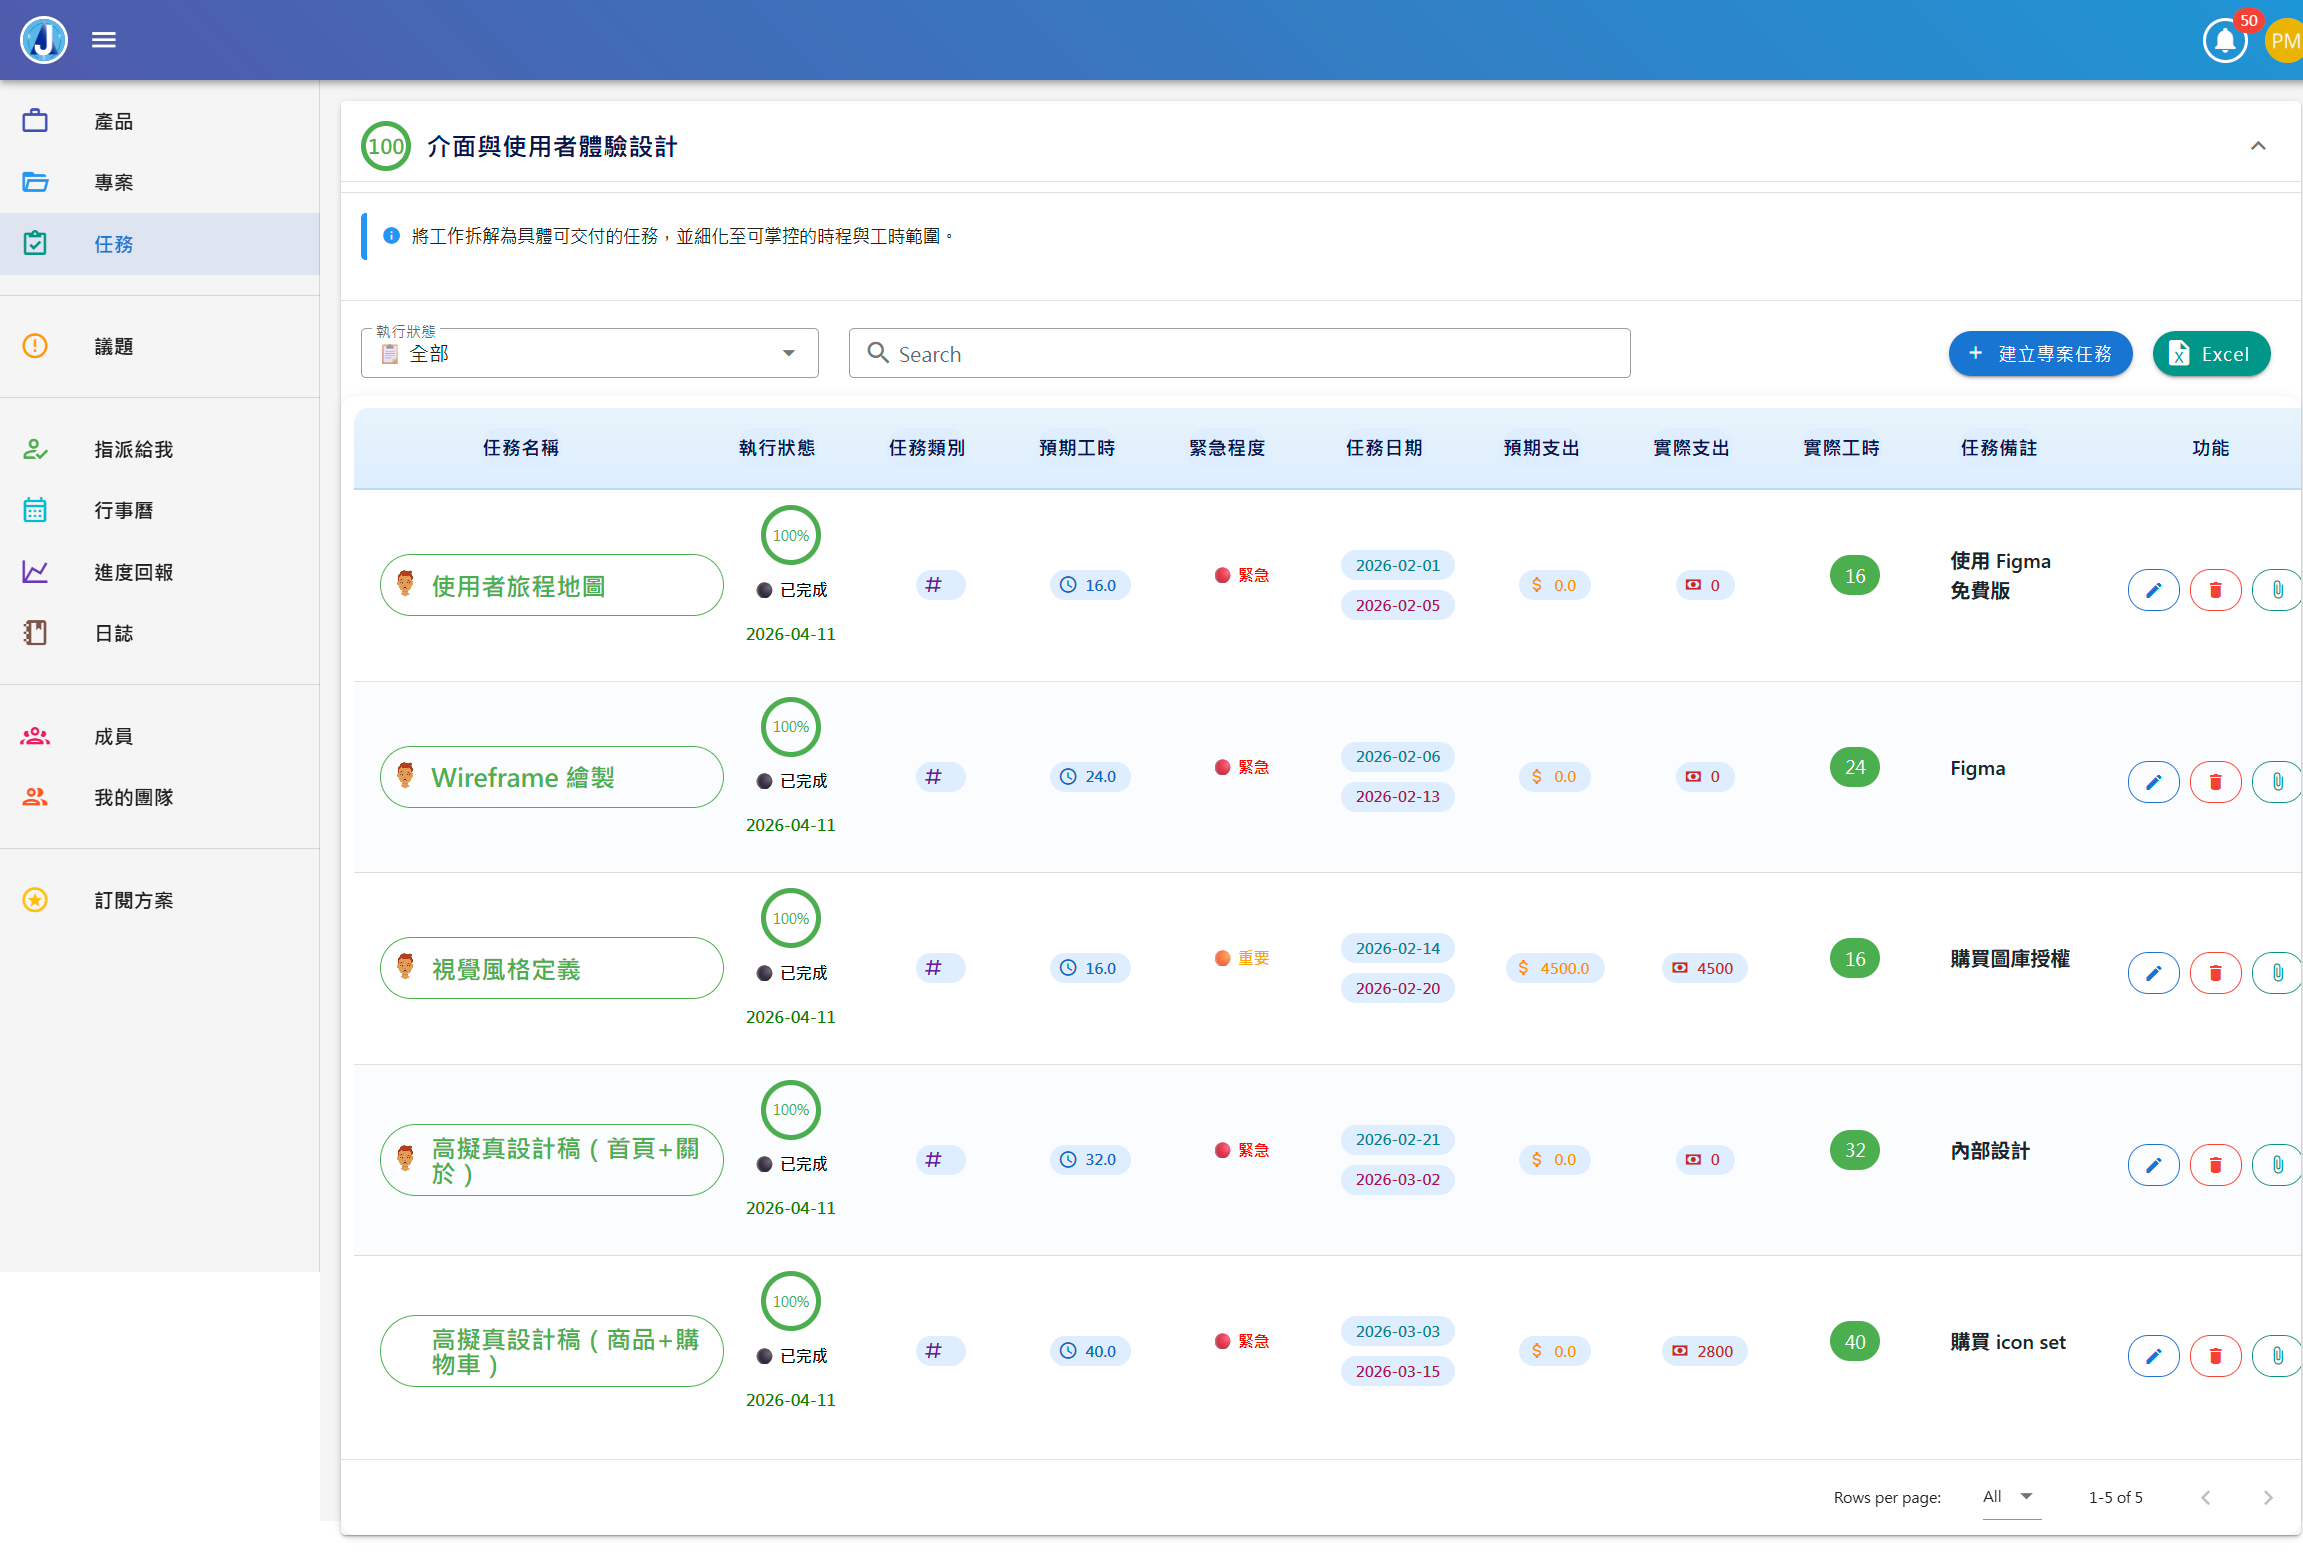
- Layer 3: Tasks
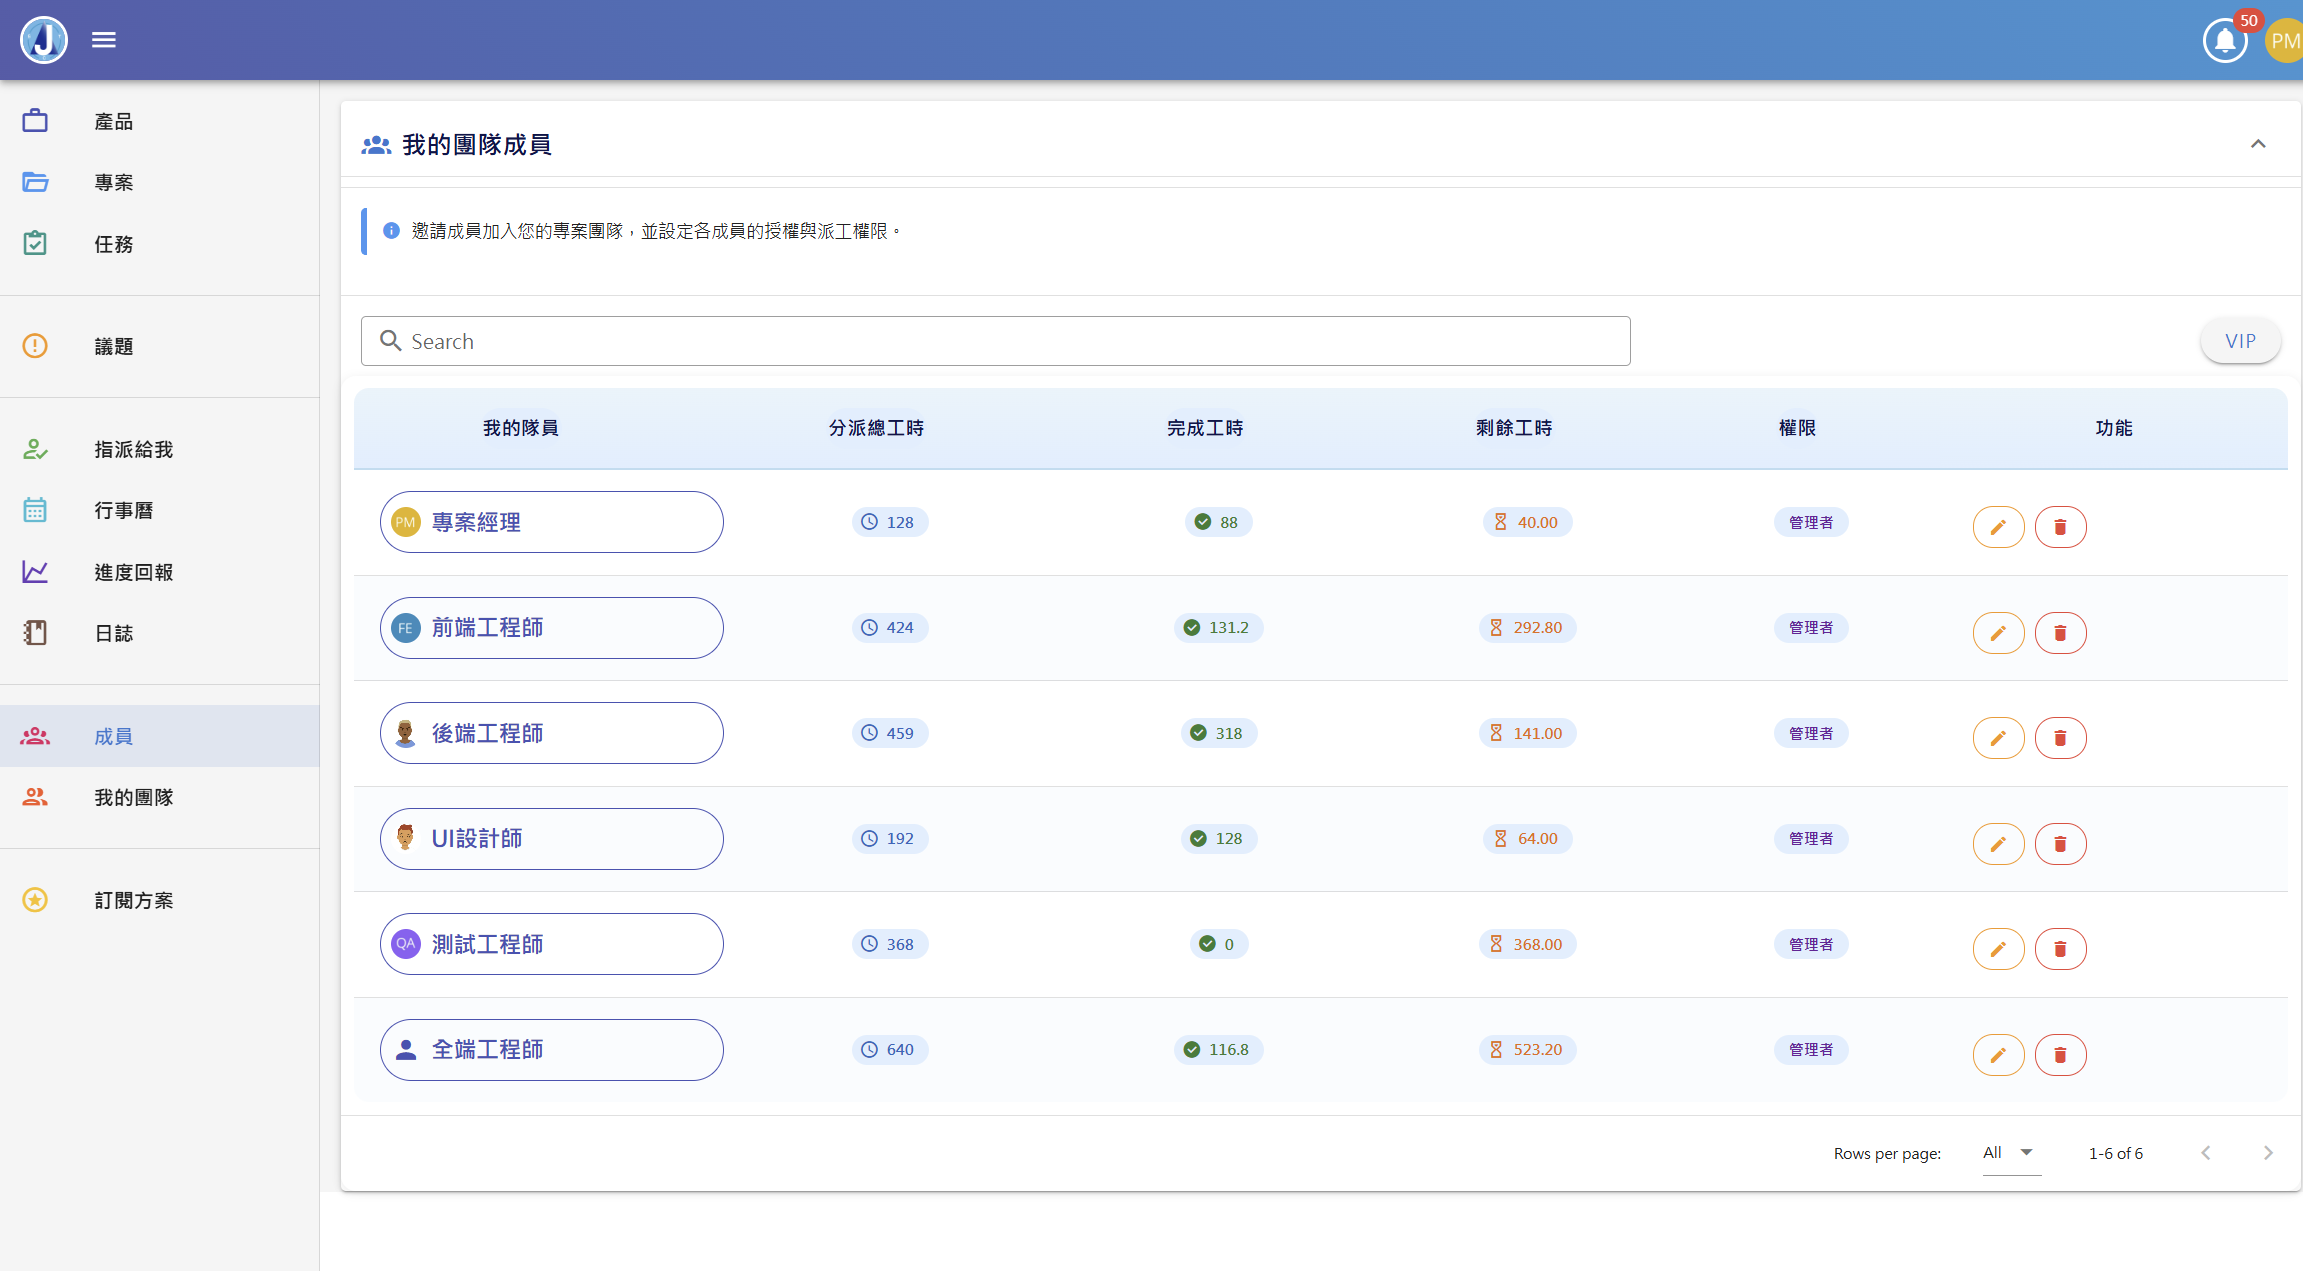
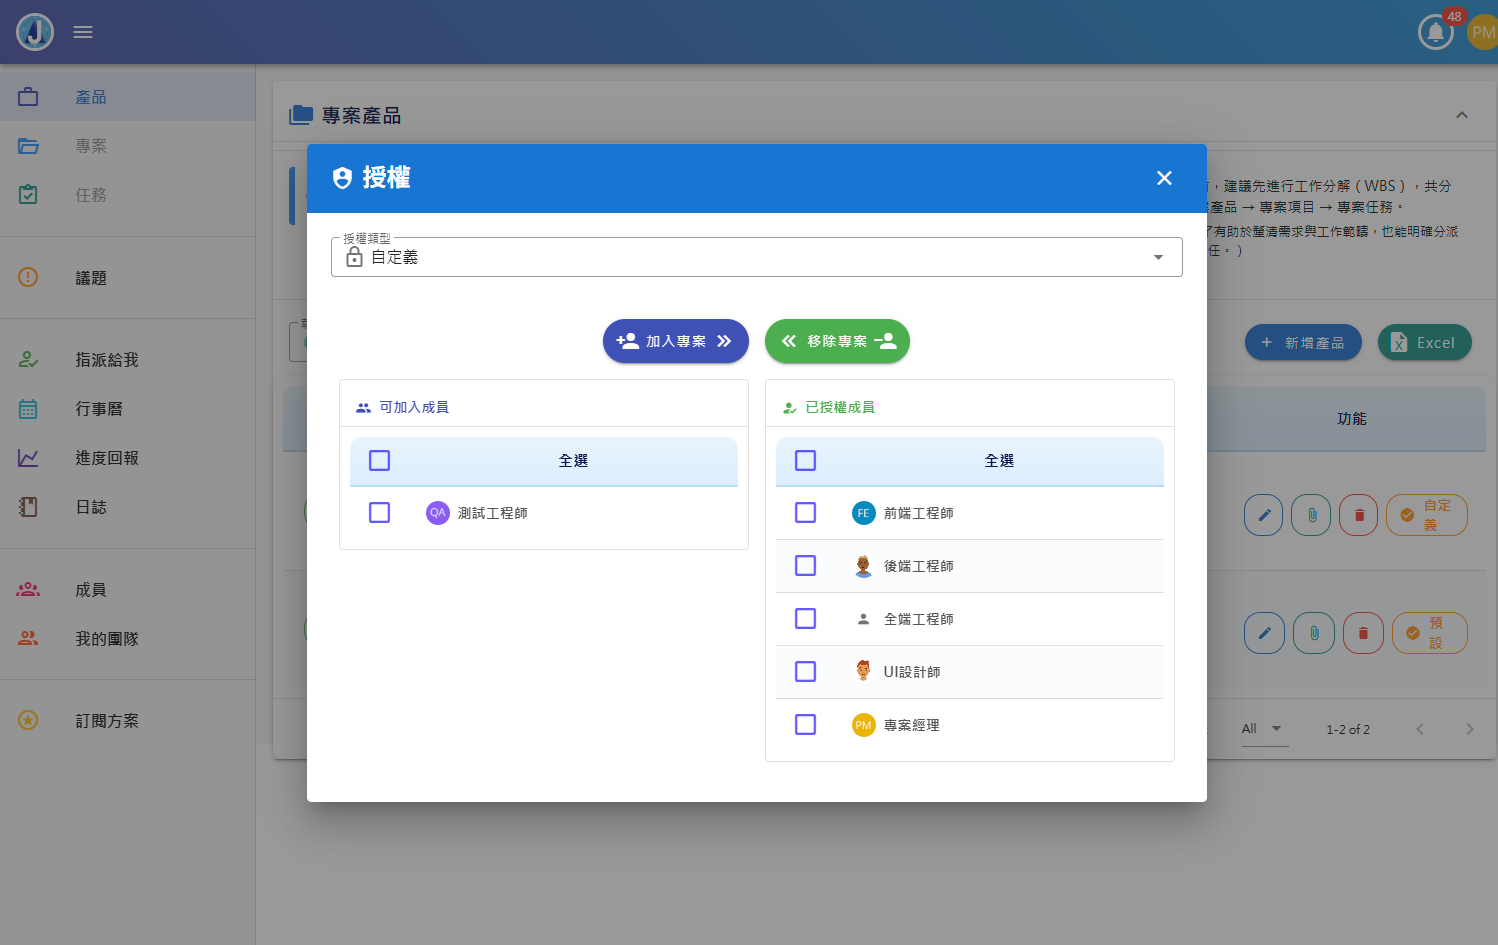
- Team Management — Invite members to join your team
- Project Authorization — Control who can see which projects
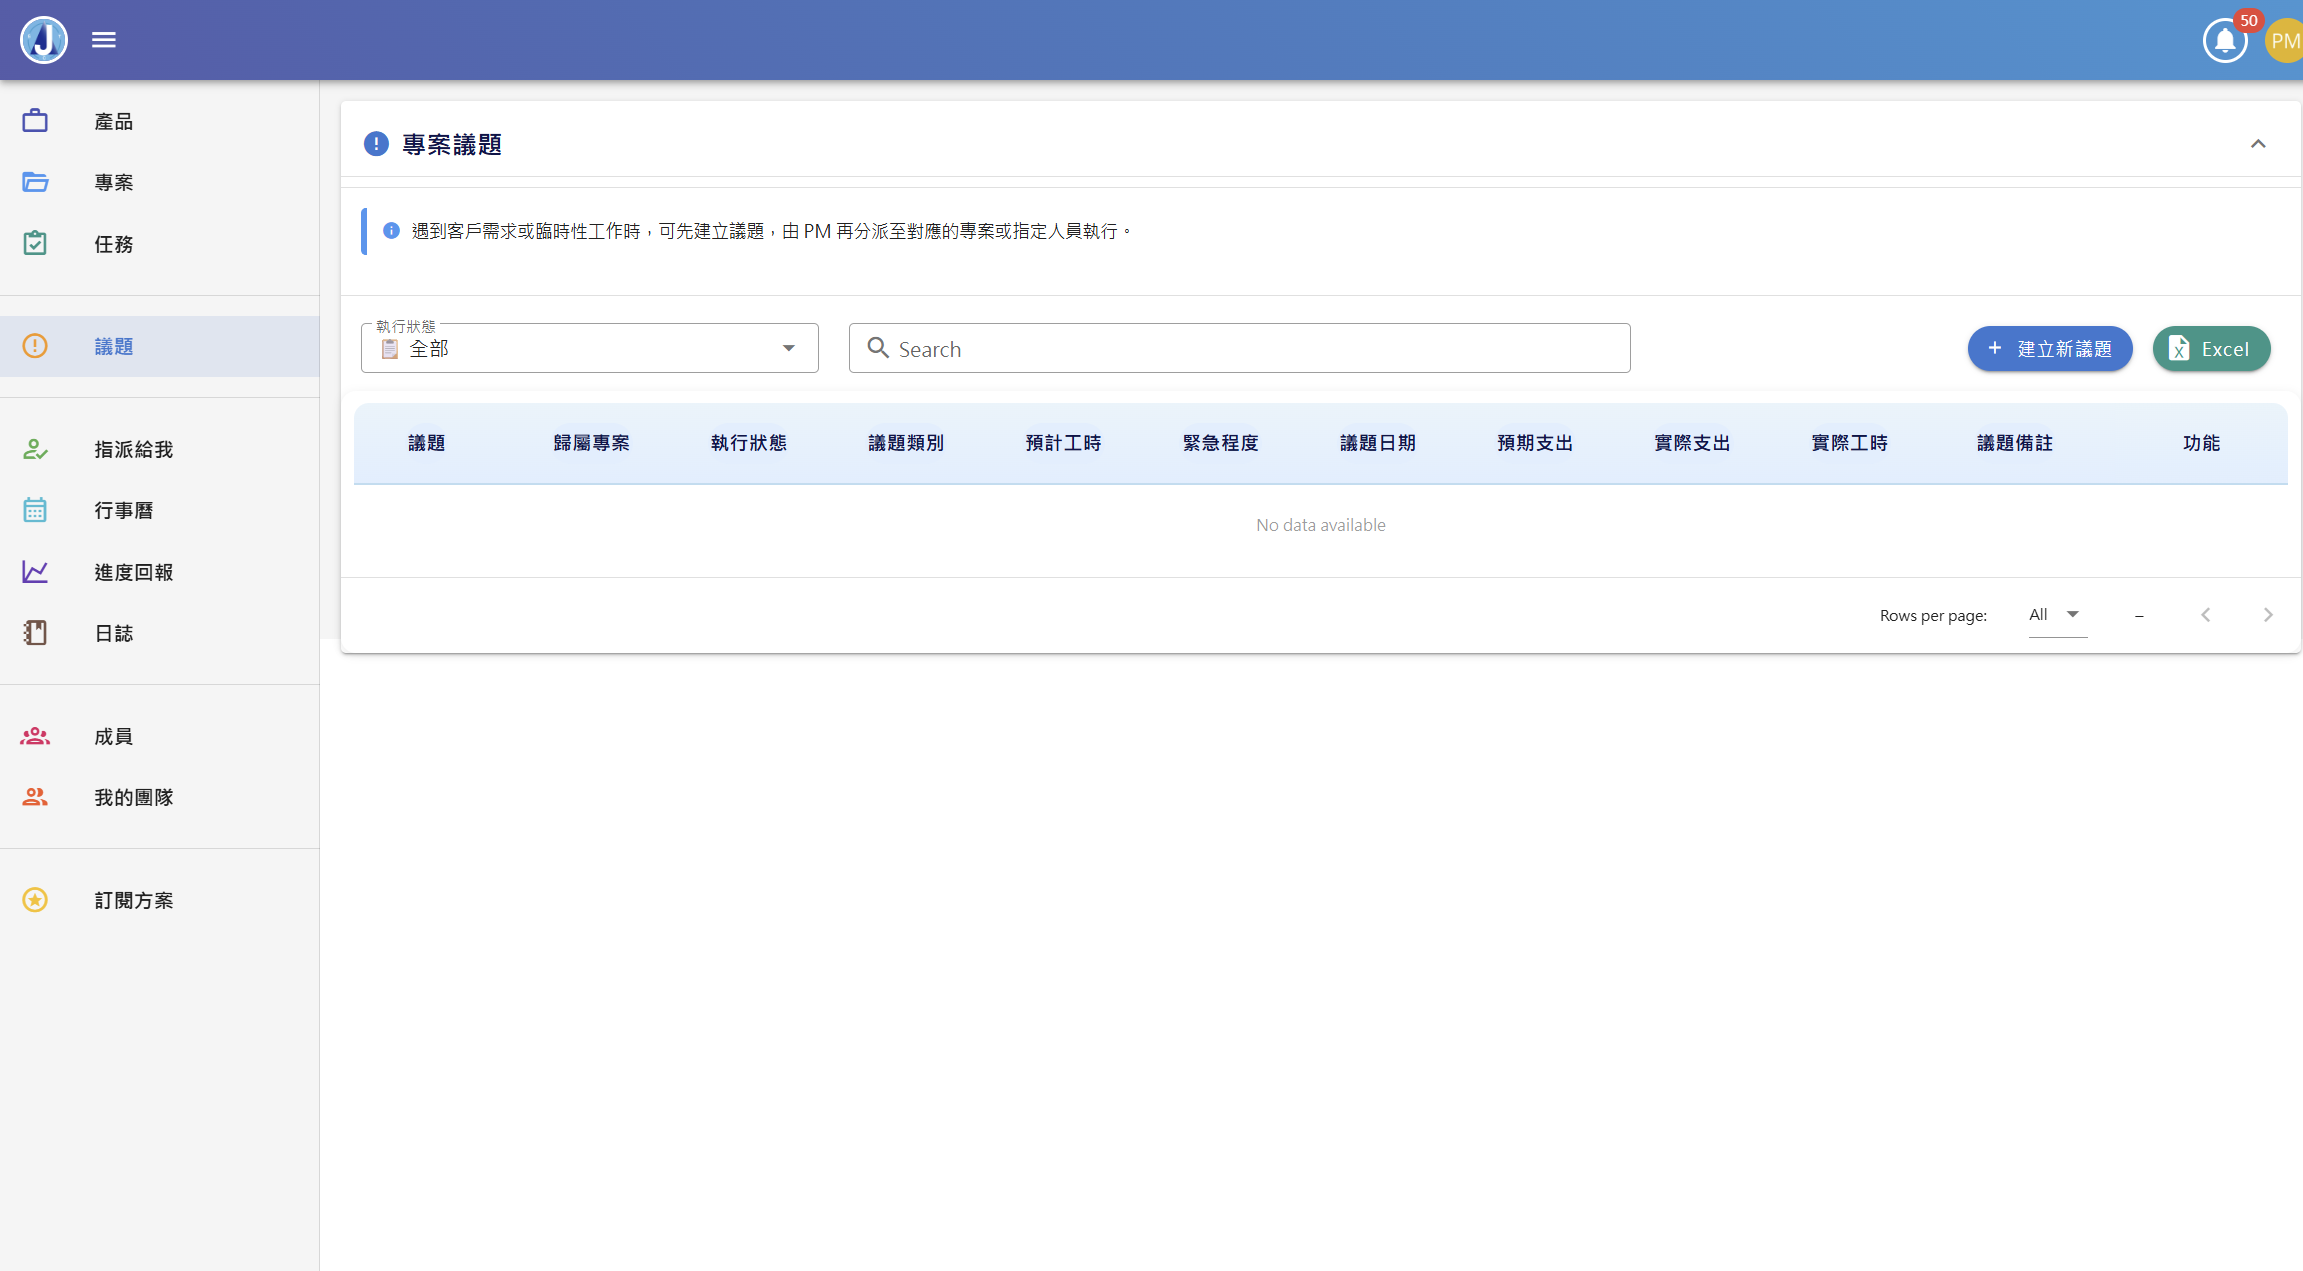
- Issue Tracking
❌ Bad breakdown: "Complete website development" → Too vague. No idea what it involves or how long it takes.
✓ Proper WBS breakdown:
Level 1 (Product): E-commerce Website Development Project
Level 2 (Work Packages): Frontend Dev, Backend Dev, UI Design
Level 3 (Tasks):
• Frontend Dev → "Build homepage carousel," "Develop product listing page," "Implement shopping cart"
• Backend Dev → "Create user login API," "Build order management system," "Integrate payment gateway"
• UI Design → "Design homepage mockup," "Create responsive mobile layouts," "Export all icon assets"
At this level, you can estimate: "Homepage carousel will take 8 hours," "Order management needs 3 days."
Sum all frontend tasks → know how long frontend takes.
Sum frontend + backend + design → know total project time and budget.
This is the core of WBS: Break down top-to-bottom, roll up bottom-to-top.
Step 2: Report Daily Progress
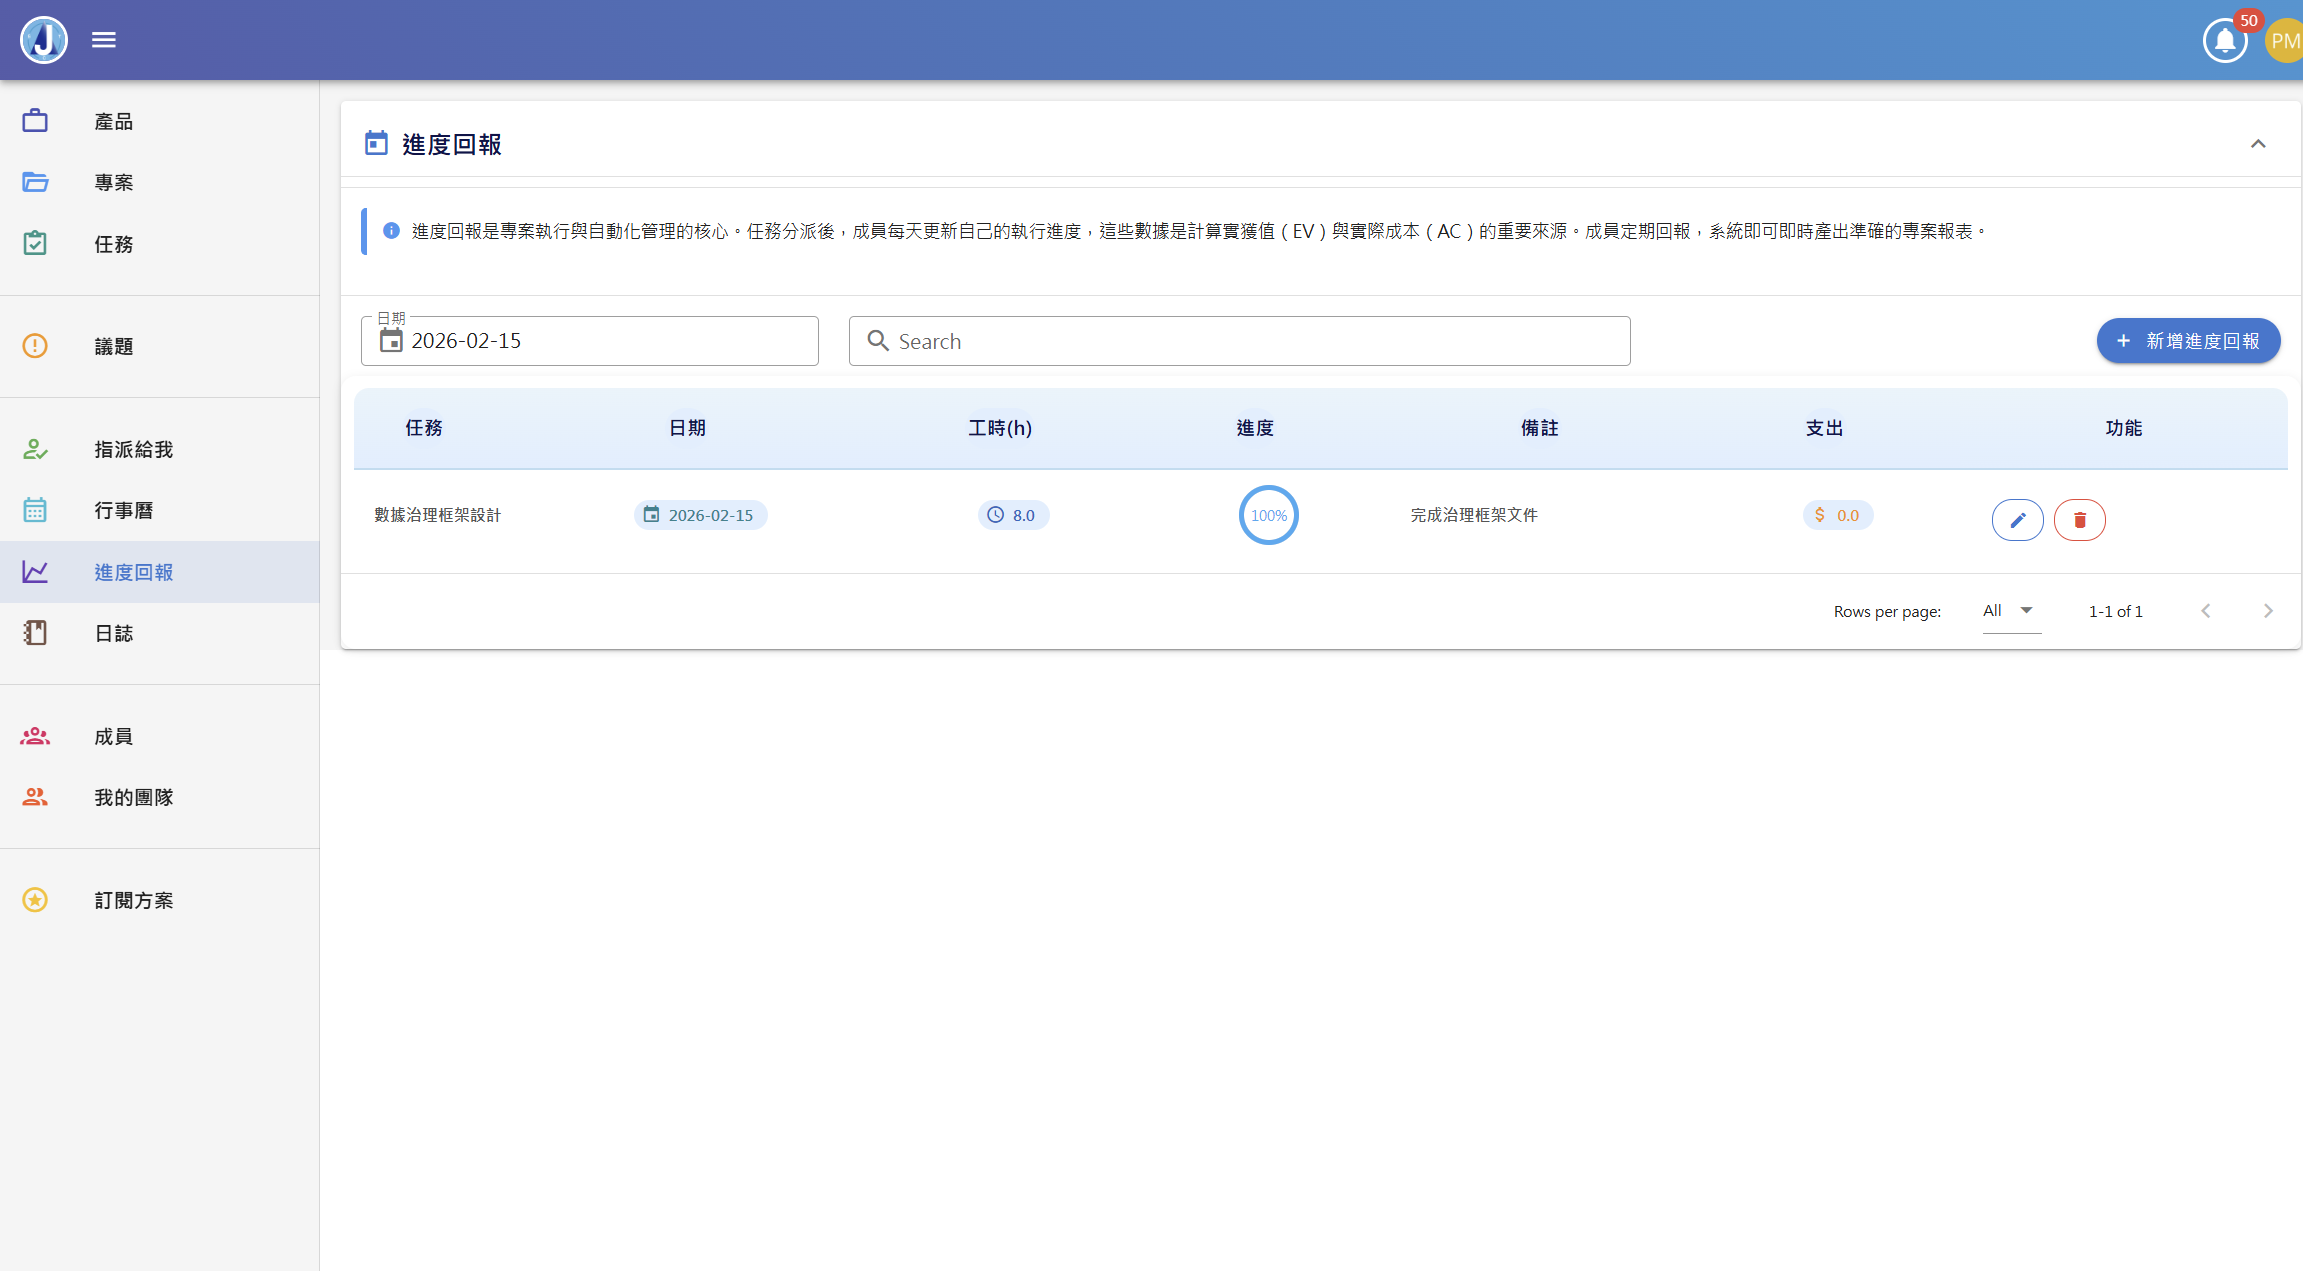
Each team member just needs to spend a few minutes each day submitting their "progress report." The system then automatically calculates "actual progress" and "actual cost," and compares them against "planned work" — no manual report compilation needed.
- Progress Report
- My Tasks
Actual Cost: How much time and money you actually spent.
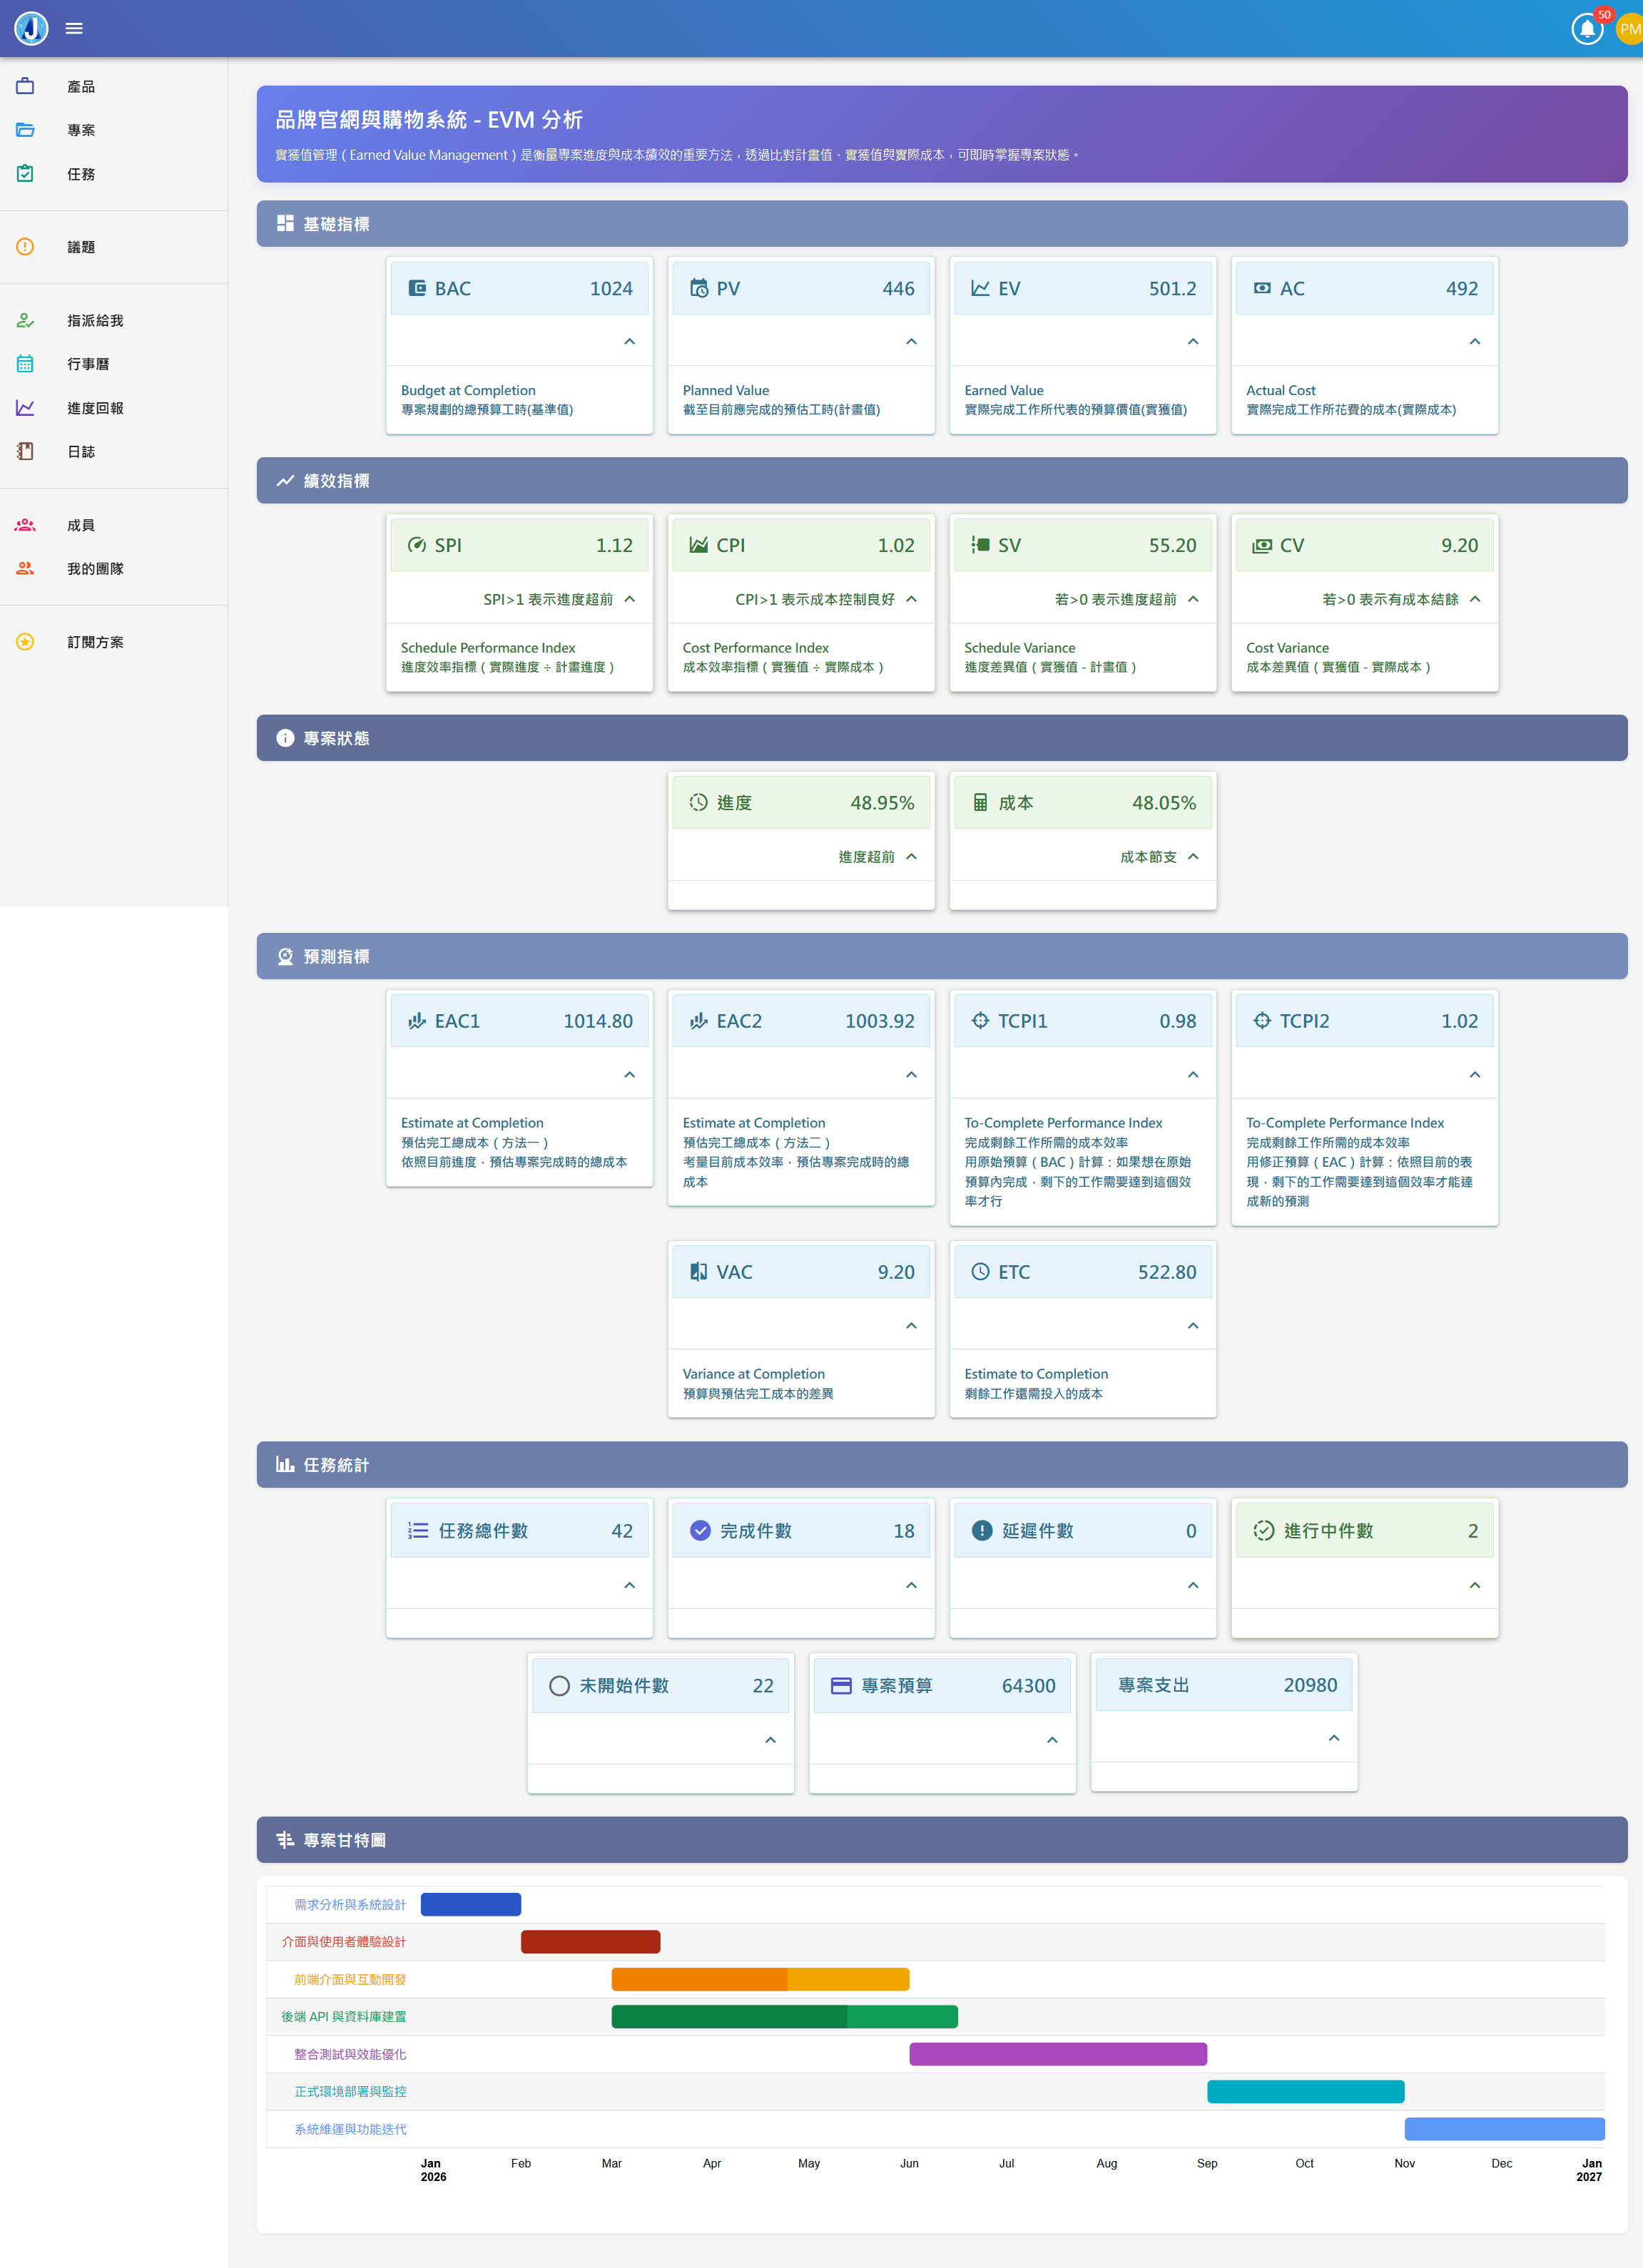
The system automatically compares "actual progress" and "actual cost" against "planned work," calculates schedule and cost performance indices, and predicts when the project will finish and how much it will ultimately cost. All fully automated — no manual calculations needed.
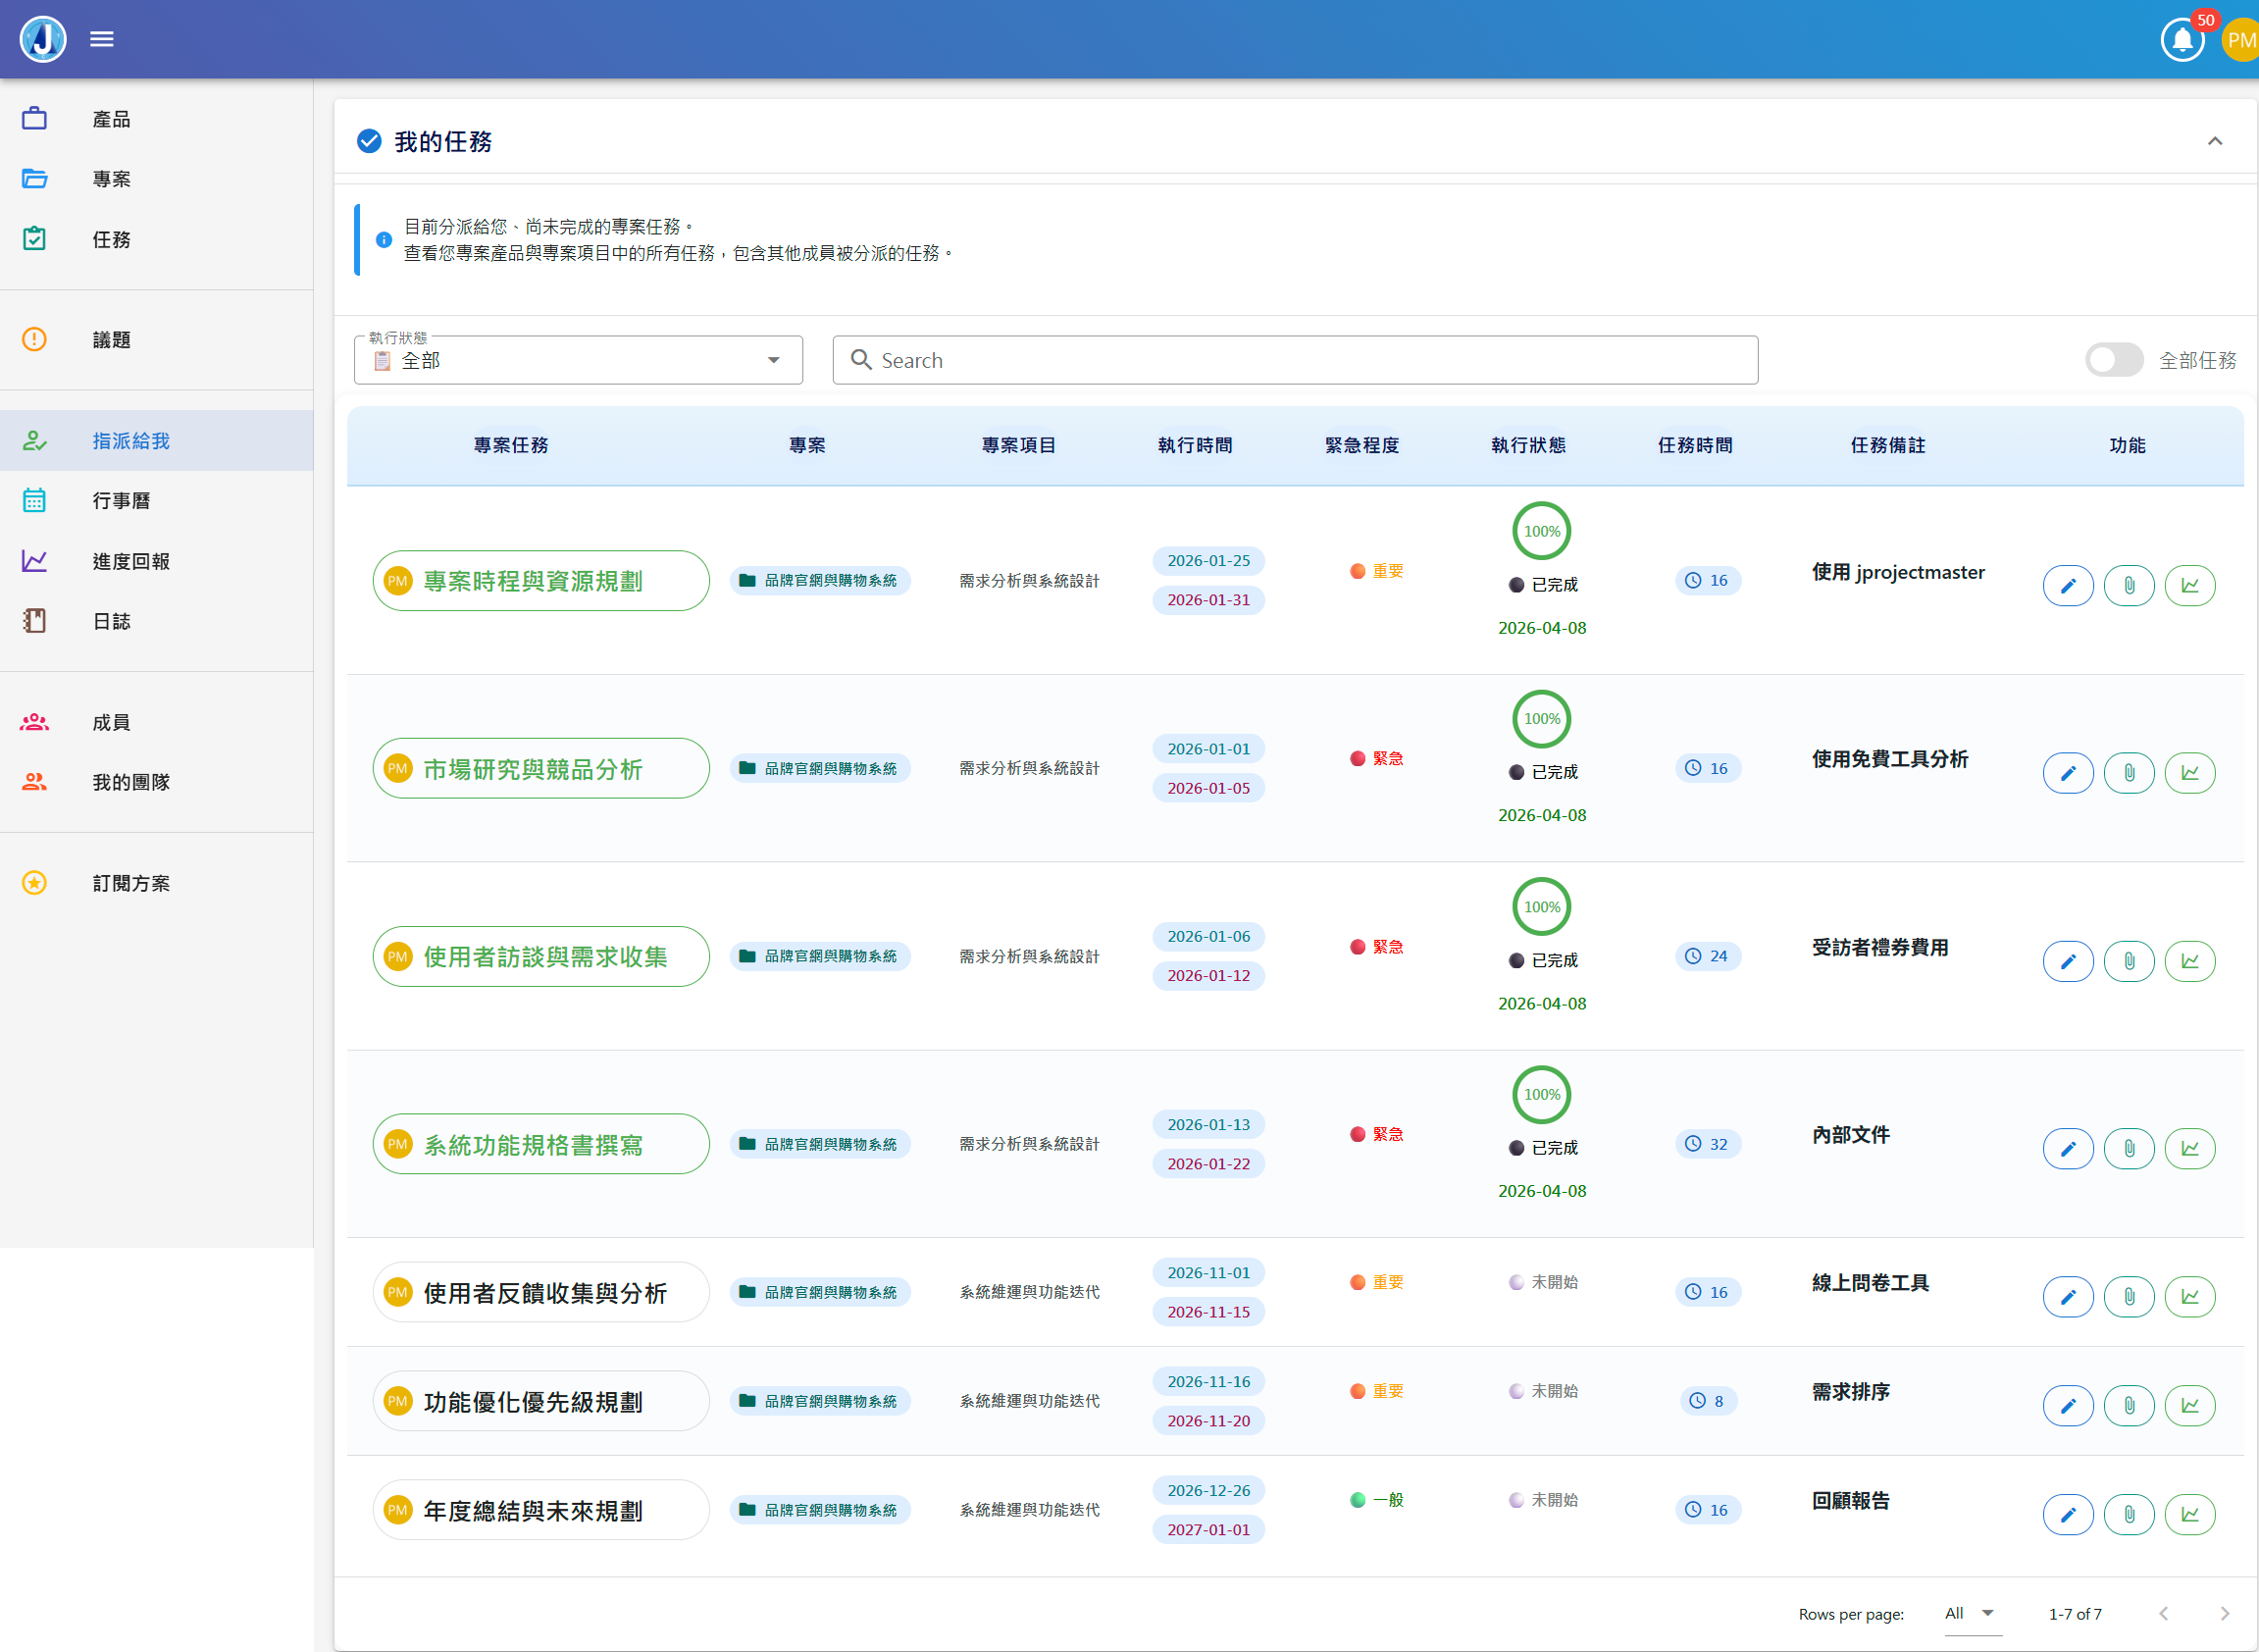
• My Tasks — Quickly view all tasks assigned to you and track your personal work progress.
• Team Tasks — As a PM, view team members' task assignments and execution status to fully monitor project progress.
Step 3: Track & Analyze Project Status
After completing the first two steps, the system has enough data to analyze — are you ahead or behind schedule? Is spending over budget? See it instantly, no more manual Excel work.
- Work Calendar
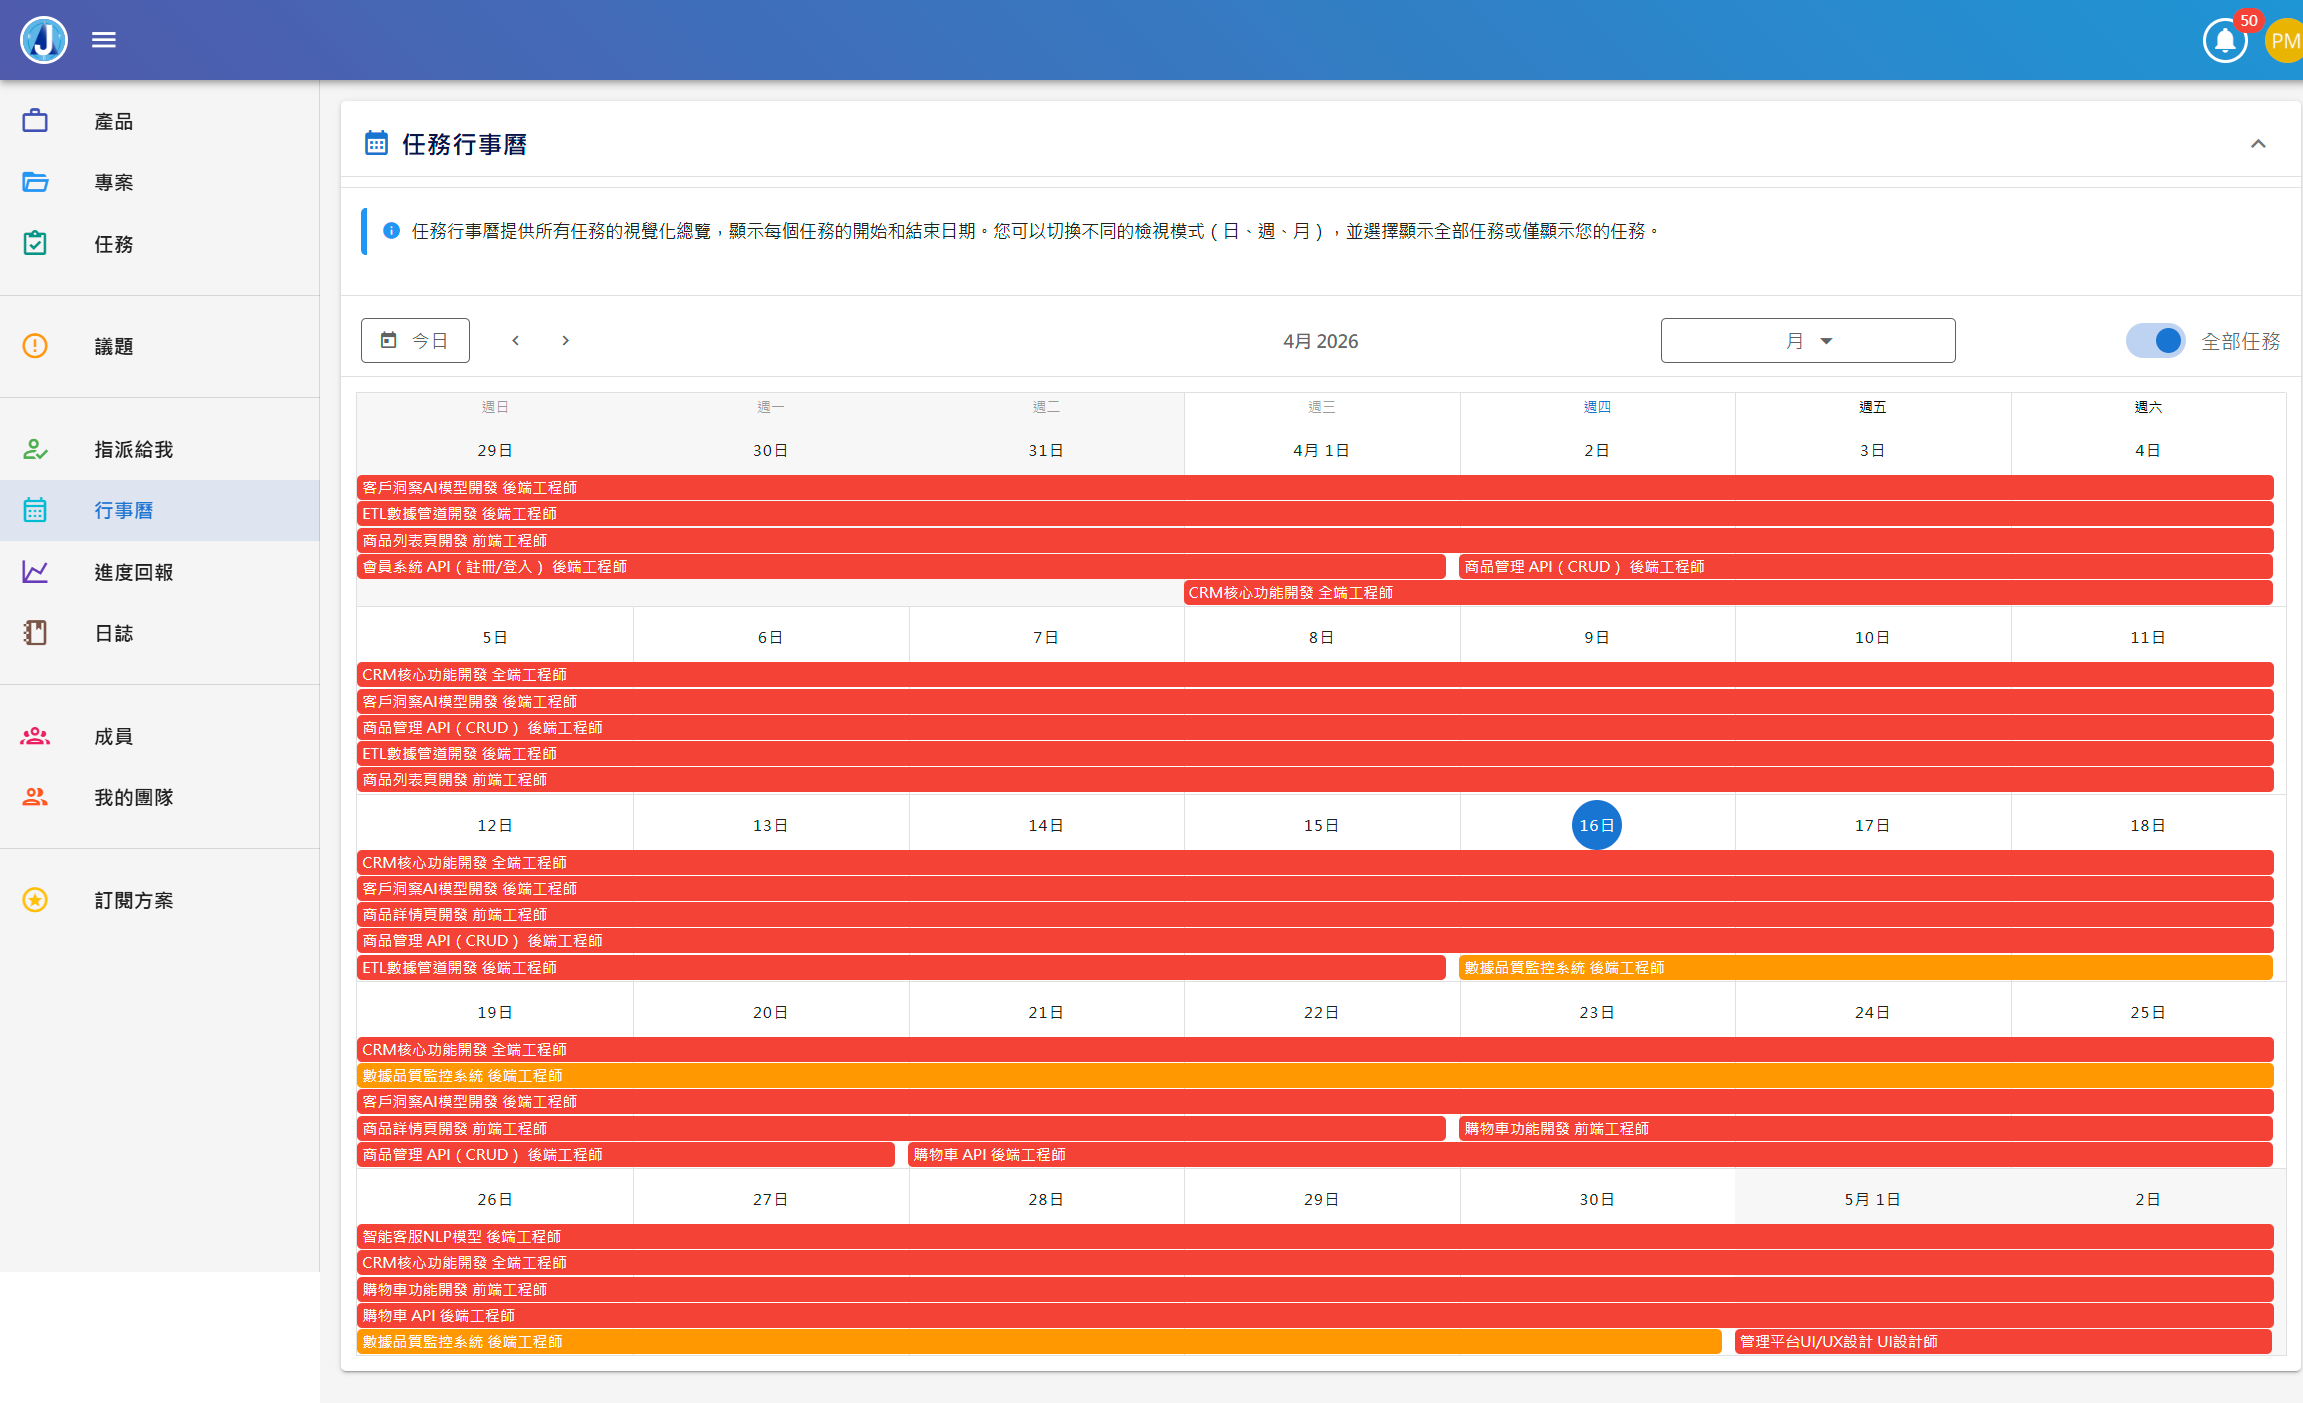
- Task Calendar
- Performance Report
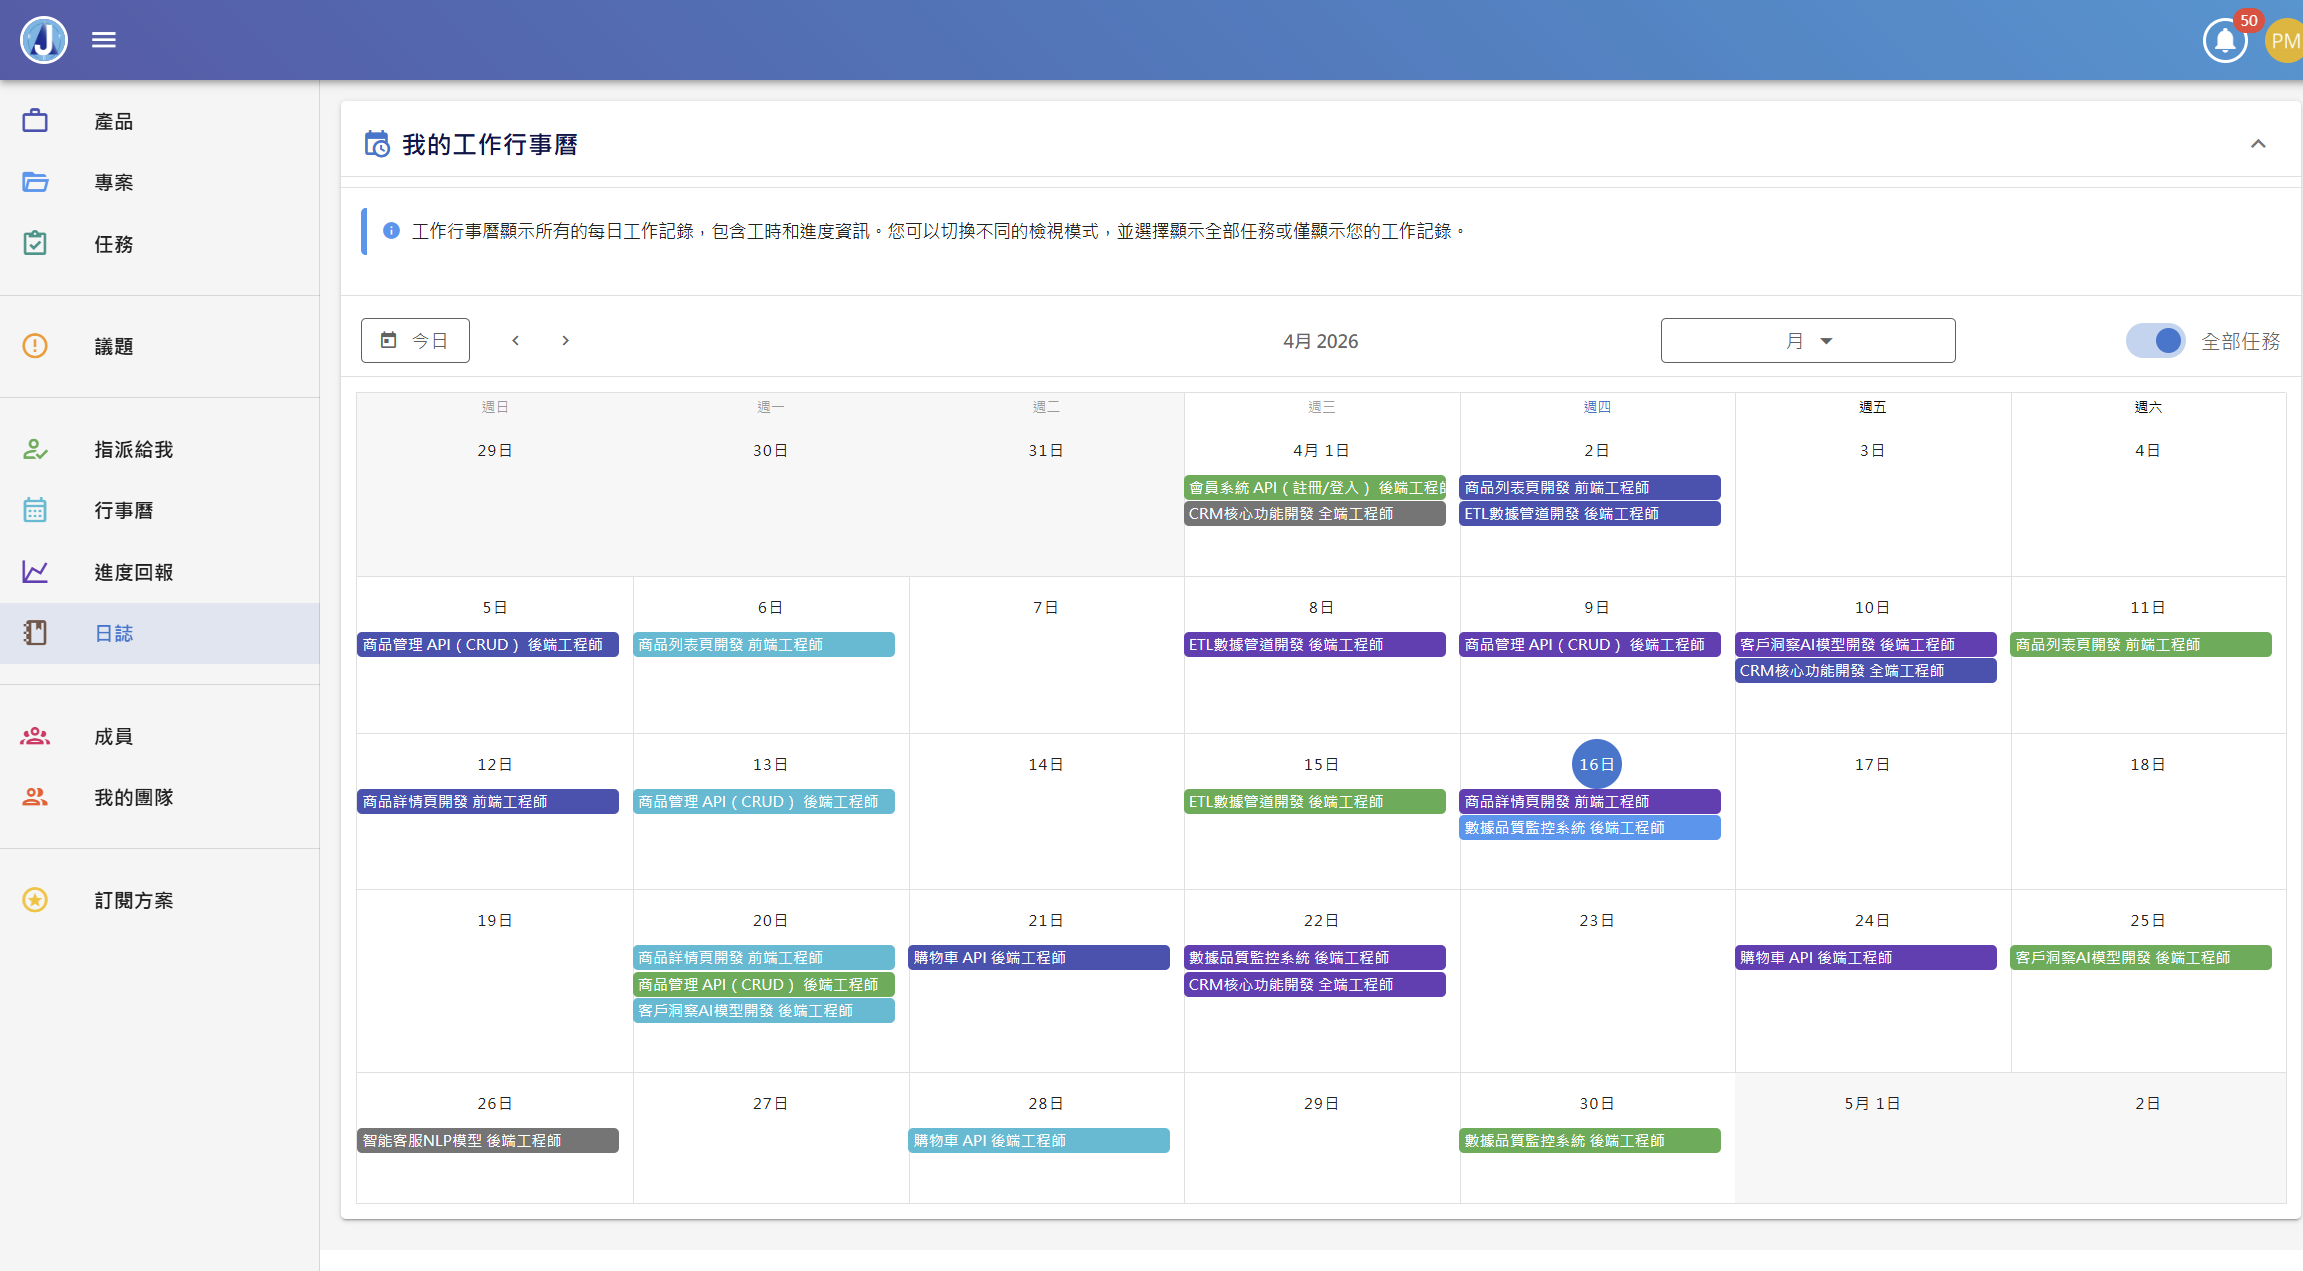
• Planned Work — Auto-calculated when you set up the project: how much should be done and spent by now.
• Actual Progress — Auto-calculated from daily progress reports: how much work was actually completed.
• Actual Cost — Auto-calculated from daily progress reports: how much time and money were actually spent.
With these three numbers, the system automatically tells you:
• Is the project ahead or behind schedule?
• Is spending efficient? Any overruns?
• At this rate, when will it finish?
• How much will it ultimately cost? How much more is needed?
All generated automatically — no manual reports required.
🔑 Test Accounts Available
Try our test accounts to experience full features. All passwords are 12345678
test_david_pm42
12345678
test_michael_qa73
12345678
test_jessica_ux56
12345678
test_thomas_fs19
12345678
test_rachel_be88
12345678
test_kevin_fe2024
12345678