

J Project Master
Project Decision & Risk Prediction System
Identify Risks Before They Derail Your Project
Predictive analytics for cost overruns and schedule delays — empowering data-driven decisions at every stage
Halfway Through, You Realize It's Already Over Budget
Daily meetings, but you still can't tell if the progress is real. The team says they're almost done, but you're not sure if they're stalling.
Spent Half the Budget, No Idea If You'll Break Even
"Boss asks if this project will profit or lose. All I can say is... I think we're okay?"
💸 By the time you realize you're losing money, it's too late
Daily Meetings, Still Can't Tell If Progress Is Real
"Team says almost done, but they said the same thing last time — and it took two more weeks"
⏰ No data to back it up, just guessing
Team Reports Progress, But You're Not Sure If They're Stalling
"Says 90% done, but the last 10% has taken a month and still counting"
📊 No objective data to verify actual progress
Building Reports Is More Exhausting Than Running the Project
"Boss needs a report, so I spend two days in Excel — but the data still isn't precise"
⏳ Time spent organizing data, not managing projects
❌ This Is the Result of "Managing by Feel"
Early: Everything looks good → Mid: Start adding people and budget → Late: Realize you're way over budget and behind schedule
What Do You Get After Implementation?
Not just improved efficiency — direct answers on "Will this project profit or lose?"
The hardest part of project management? Not knowing where things actually stand.
J Project Master keeps it simple — you only do two things:
❶ Set up your project structure (define time and budget for each task)
❷ Team spends 2 minutes a day reporting progress
Everything else is automatic: progress comparison, cost analysis, completion forecasts, charts and reports — just open the dashboard and see.
Automatically Calculate "Will It Lose Money?"
No formulas to learn. No manual calculations.
After you report progress, the system instantly tells you: Is the project profitable right now, will it be delayed, and how much will it cost in the end?
Other tools only allow you to manually track progress. We directly tell you whether the project will lose money.
Know in 30 Seconds Whether Your Project Will Lose MoneyFrom Task Management to Decision Management
Automated Progress Tracking
Team members submit progress updates, and project status synchronizes automatically
Eliminate manual status meetings and compilation work
Auto-Generated Performance Reports
Planned vs. Actual progress vs. Actual costs
Automatically calculated — eliminate manual spreadsheets
Comprehensive Time Tracking
Automatic time aggregation from task level to total project hours with full visibility
Real-Time Budget Alerts
Compare planned budget against actual expenditure and progress in real time
Instant notifications for cost overruns and schedule variances
Resource Workload Visibility
Monitor team capacity and task allocation in real time Optimize resource utilization and prevent burnout
Predictive Completion Forecasting
Advanced algorithms analyze current performance
to forecast completion dates and final project costs
Team Collaboration Management
Streamlined team onboarding within the platform
Seamless invitation system eliminates external communication tools
Project Access Control
Set who can see each project and who can’t
Confidential data stays protected, permissions stay clear
Just 3 Steps, See Results Instantly
No learning curve, no setup — start using right after signup
Create Project(or use sample)
Enter project name, budget, timeline — or load a sample project.
Daily Progress(2 minute)
Spend 2 minute daily: what's done, what's spent. That's it.
See Results(overrun/delay/forecast)
System auto-calculates: profit or loss, delays, final cost
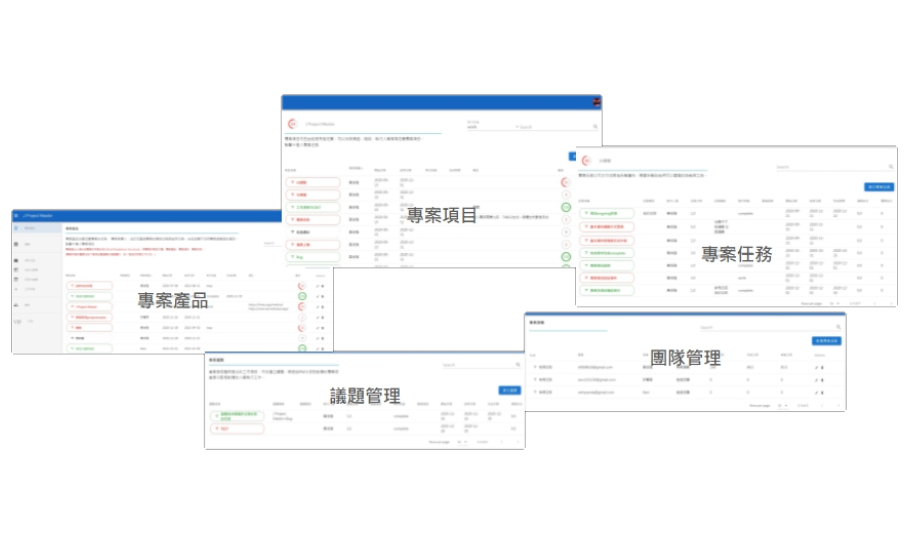
Break Down the Work
Visual project decomposition
Product → Work Package → Task: Three-tier structure auto-manages owners and schedules
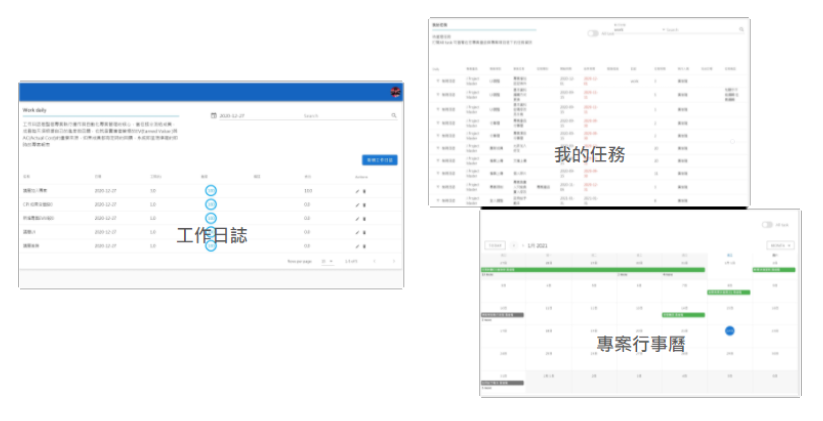
Spend 2 Minutes a Day
Fill in daily progress, system auto-updates all metrics
Calendar keeps all task schedules in view
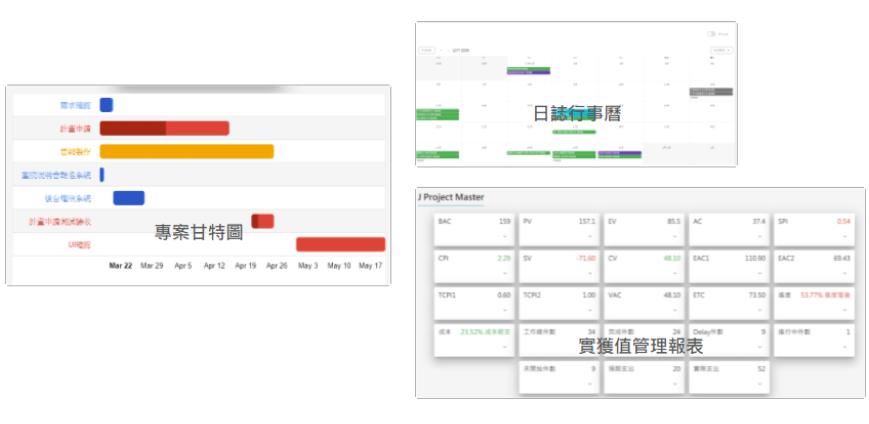
Auto-Analyze, Clear Insights
Real-time project health monitoring
System auto-calculates completion forecasts and final costs, with instant alerts for delays and overruns
Why Not Use Notion / Excel / MS Project?
Our Competitive Advantage
While numerous PM tools exist, few provide predictive risk analysis and decision support intelligence.
Typical PM Tools
Great for task tracking, but they don't calculate cost performance automatically. You need Excel for PV, EV, AC. Spend 2-3 hours weekly on manual updates, and by the time you have the data, the project's already off track.
Excel / Spreadsheets
Can compute EVM, but everything is manual. Data is scattered, versions get messy, and it doesn't scale with team size.
Primavera / MS Project
They have EVM features, but extremely steep learning curve and complex setup — requiring specialized personnel to configure and interpret reports, making them difficult for small teams.
J Project Master
Report progress and risk alerts are generated automatically. No formulas to learn, no Excel to maintain. The system proactively tells you: Will costs overrun? Will schedule slip? Should you adjust the plan?
📌 The only PM tool that auto-predicts risks and supports decision-making
Ideal for These Industries
Any project with defined timelines and budgets benefits from predictive risk management.
Construction & Engineering
How far along is the project? Are we over budget? Track progress and costs at every stage — clearly and automatically.
Software & App Development
How much budget has been spent? When will it ship? Stop guessing — the system tells you automatically.
Government & Public Projects
Many government projects already require progress and cost reports. The system generates them automatically — no manual work.
Product Development & Manufacturing
How long will the new product take? How much will it cost? See progress and spending at every milestone.
Project Management Consultants
Managing projects for clients? Give them a tool to see project status anytime.
Schools & Research
Taking a PM course and want hands-on practice? Running a research project? Just use this system to get started.